14.11.25./16.12.25
schmittbuxbaumscience.com
info@schmittbuxbaumscience.com
Subtitle: Experiences from a Würzburg Radiation Protection Course.
The old topics remain relevant. They are supplemented and modernized.
The online address for the current courses is:
www.uni-wuerzburg-gmbh.de/weiterbildung/strahlenschutzkurse/
The facilities have greatly improved: The Welz-Haus, located in close proximity to the train station, carries a rich history and an additional historical peculiarity. It is just a short distance from the site of the discovery of X-rays. Let the “Genius loci” inspire you.
Radiation protection can be interesting. The course provides an opportunity to address questions that are often overlooked or have no space in daily clinical practice.
In radiation protection, there are
clear principles (a) ,
approaches to problem-solving (b),
also practical issues for solutions (c):
a. There is a basic principle:
ALARA.
The dose should be “as low as reasonably achievable.”
b. It is important to clearly organize and differentiate the levels mentioned below. Ultimately, it is about responsibility. Many questions are not specifically “X-ray-related.” Similar issues arise in other fields, involving the (necessary) interplay between technical guidelines and daily practice. To what extent can responsibility be delegated?
- – Indication
- – Equipment technology (design and maintenance to achieve high safety)
- – Application technology (training and monitoring)
- – Diagnosis (further education). Another pillar of radiation protection —
c. How do I demonstrate competence in a quality issue? What decisions do I make when faced with a limited examination? What measures are appropriate?
Regarding “a”. The course aims to address whether and to what extent the “ALARA principle” can be improved in all areas from indication to diagnosis.
Our guidelines are the X-ray Ordinance and the Radiation Protection Ordinance.
Regulations do not replace common sense or responsibility. The course is a space to discuss and promote the further development of legal regulations.
Such points include:
– The automatic documentation of the dose-area product (cGy x cm²) on every document (image). Or in computed tomography, the length dose document.
– The possibility of collimation and centering not during continuous fluoroscopy but in “last image hold.”
– Organ filters (filters for specific regions), which prevent regional overexposure and thus improve not only quality but also reduce dose. This is a favorable combination! (Often, quality – e.g., lower noise – is achieved at the expense of higher doses.)


A. X-Ray Quiz
I will show you 12 images below; some have quality issues. These were partially documented by the “Medical Authority”. Can you suggest improvements while still making a diagnostic assessment?
If you can immediately identify the errors and (despite them) provide all diagnoses, the radiation protection course will simply be a review for you.
If you miss some diagnoses, the course offers a great opportunity to imprint important and typical findings into your memory (“burn it into your retina”).
Above each image is a brief, bold headline. You will receive a specific answer text by clicking on the field:
“Click to open the answer!”
Chapters B and C delve into some foundational concepts and help you view the cases from section 1 in a new “light.” It is recommended to first study parts 2 and 3 before returning to the answers for the quiz cases in section A.
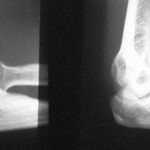
Image 1.01: The 38-year-old man was physically assaulted in a beer tent; bleeding injuries; X-ray of the left wrist, d.v.

Understanding X-ray images relies heavily on the concepts of the summation effect and the silhouette sign.
Simplified: Summation means that the thicker and/or denser the object, the more the radiation is attenuated. Contrast arises from differences in radiation attenuation.
Many of the images appear as if they are underexposed. They are not ideal for diagnosis. The brightness range on the PC is often not optimal, and we must keep this in mind.
Silhouette refers to the boundary between a denser and a less dense structure; it is depicted most sharply when it is parallel to the path of the X-ray beam. (See also topics 04 – 07 on pleura/rib pleura.)
The pisiform overlaps with the triquetrum. The hamulus overlaps with the hamate (summation effect). All carpal bones have distinct silhouettes; only between the trapezium and trapezoid do the rays not pass through a suitable joint space. What does the irregular, angular structure at the trapezoid/base of the second metacarpal mean?
To find the answer, read the response section or click on the image for preliminary information. Alternatively, first study chapters 2 and 3; they provide additional context to approach the image with a deeper understanding.
It goes without saying that you should not neglect to examine the patient’s hand very carefully!
Check for external contaminants? Puncture marks? Injuries? Of course, also test the long and short thumb flexors: Is one of the flexor tendons severed?
Until proven otherwise, the elongated shadow should be considered a glass shard. Glass is embedded in the soft tissues; glass is about twice as dense as soft tissue and approximately matches the density of cortical bone (+/-). The effective atomic number also plays a role. (See WGH Schmitt, K.-H. Hübener: Density of Wood, Plastics, and Glass. RöFo. 135 (1981) 2512-17)
The radiation attenuation of this foreign object overlaps with that of the bone. A typical summation effect.
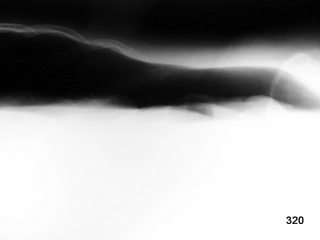
Image 1.02: 53-year-old motorcyclist overturned. Excerpt from the thorax
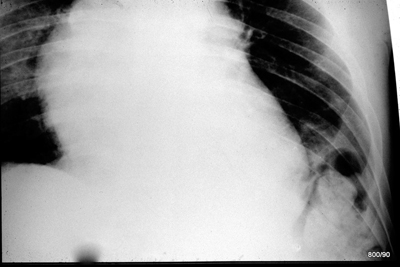
Excerpt from chest X-ray. Heart weakly penetrated, contrast exaggerated: KV too low? _Patient history: no abnormalities, no surgeries, no hospital stays.
Is the examination usable? (An important medical decision; also a critical question for the Medical Authority). – Despite the quality issues: What is the diagnosis?
Consider: A diaphragm curve (especially without a prior lung history) must show a clear silhouette. If it doesn’t, you should be alarmed! –
Traumatic diaphragmatic rupture.
The diagnosis underscores the urgency of treatment.
As far as the image excerpt allows, there is also evidence of a lung contusion in the right middle/upper field (consolidation of normally well-aerated lung tissue).
Image 1.03: Also a motorcyclist; 23 years old; overturned at very high speed.

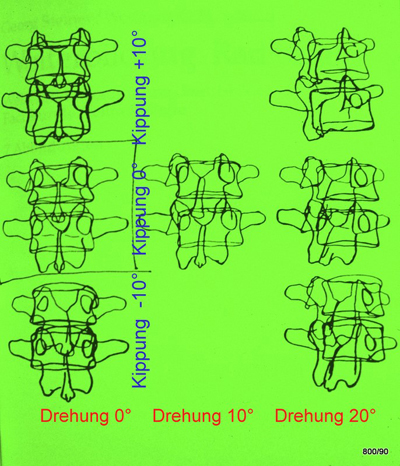
The key to interpreting the image lies in the silhouettes. The vertebral bodies and arch structures create classic silhouettes, allowing conclusions to be drawn about the positioning of the equipment or the rotation (or tilting) of the bony elements (= projection).
Diagnosis: Dislocation of L4/L5.
The diagnosis underscores the urgency of treatment.
The key to interpreting the image lies in the silhouettes. The vertebral bodies and arch components create classic silhouettes, enabling conclusions about equipment positioning (misalignment) or pathological rotation (or tilting) of individual bony elements.
At L5, the spinous process projects into the center of the vertebral body: as expected in such an image, this vertebra is not rotated to the right or left. The pedicles of L5 are very symmetrical.
The vertebrae above L5, from L4 upwards, show a deviation of the spinous process relative to the frame contour of the vertebral body (VB). This clearly indicates a rotation to the left.
Note also the:
– Lower articular process of L4 on the right, and
– Upper articular process of L5 on the right. Both have lost contact!
S1.03b illustrates our schema for rotation and tilting of two lumbar vertebrae. The position of the spinous process relative to the vertebral body frame is a reliable measure for assessing vertebral rotation and tilting. A standardized imaging technique is assumed.
Image 1.03b: Please also assess the rotation based on the increasing asymmetry of the pedicles and the tilting based on the transverse and articular processes. Next image will provide additional help.
Continue X-Ray Quiz 4-7
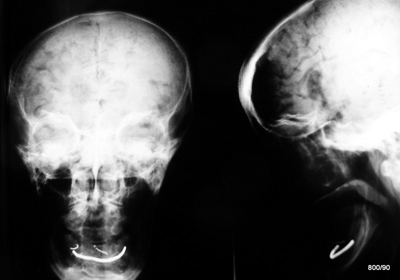
Image 1.04: 38-year-old patient; intoxicated; involved in a brawl; strong impact to the chin; now minimally cooperative.

What simple question and what simple examination are particularly important given this history?
The indication for plain skull X-rays must be strictly evaluated. If the number sequences do not align, this could provide a diagnostic clue.
Bone diagnostics often rely on silhouettes and interruptions in contours. Do two physiologically related bone structures not align? (See also topic 03). Or has the harmonious relationship between the head and socket been disrupted?
Here, the dental arches of the upper and lower jaws do not align. Why? One of the most critical possibilities is a:
collum fracture of the mandible,
along with subluxation of the mandibular condyle, both on the left side. This results in two injuries, similar to what occurs with a “segmental fracture” in the middle of a bone. Consequently, there is significant displacement of the fragments. Spontaneous healing of this injury would only occur with severe deformities and corresponding functional impairments. Show the fracture!
Often, a CT scan is the preferred option. However, if this is not quickly available, a Clementschitsch view is often more informative than a suboptimal “Schüller” view or a poorly performed “hanging jaw” projection. Clementschitsch. Remember: Two “tsch” sounds!
This case is also educational for other injuries, particularly “luxations,” where the silhouettes of the head and socket no longer align!
–
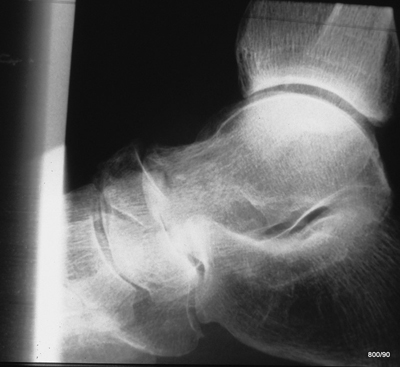
Image 1.05: The 53-year-old patient fell 7 meters. According to witnesses, he landed on his feet and then fell on his buttocks. He sustained a vertebral fracture.

On the 5th day of hospitalization, after the vertebral fracture was treated, the patient complains of additional pain in the left heel.
X-ray: Excerpt from an “ankle joint with heel bone,” lateral view. The dorsal collimation could be improved. The indication for this conventional examination is open to discussion. It can only be justified if interpreted correctly. But how?
Please display the joint surfaces of the Chopart joint. Do the silhouettes of the joint components align harmoniously?
What about the joint silhouette of the posterior talar articular surface of the calcaneus? Does it align as expected?
Joint-depression fracture of the calcaneus.
The entire body weight is borne by the “posterior talar articular surface.” The mechanism of injury is consistent with this type of fracture. A portion of this joint surface has collapsed, one might say “chiseled off,” and is driven into the calcaneus. A computed tomography (CT) scan with carefully planned imaging planes and appropriate reconstructions will be very helpful in determining the necessity of a surgical correction.
Image 1.06: 84-year-old patient. Fall on the basement stairs.
The quality of the X-ray examination leaves much to be desired: commonly observed overexposure of thinner, calvarial areas and underexposure of central skull regions.
Too low kV? Would a skull filter be useful?
How do these structures in the neurocranium, resembling gyri and sulci, arise?
Pneumocephalus. Traumatic (previously unlocalized) CSF fistula: replacement of cerebrospinal fluid (CSF) by air. Compression effect on the cerebrum resulting in “atrophy.” Air is also present interhemispherically and in the anterior horns of the lateral ventricles (supine position).
The CSF fistula was not identified but fortunately closed spontaneously. No infection occurred. Spontaneous resorption took place without any neurological or cerebral sequelae. A skull filter would be helpfull (and it reduces the dose).
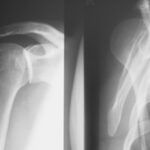
Image 1.07: 53-year-old cyclist collided with a lamppost with his shoulder. X-ray: right shoulder a.p. and so-called “Y” view.
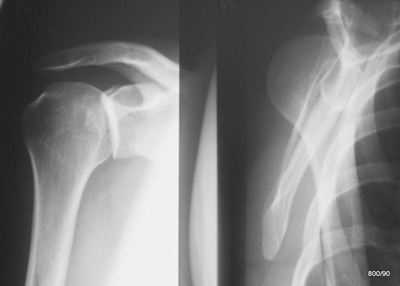
Left Image 1.07:
X-ray of the right shoulder a.p. (The healthy side is slightly elevated, perhaps to provide a better view of the joint space?). This attempt did not succeed. Was the body rotation incorrect?
Right Image 1.07:
The glenoid and humeral head relationship is disrupted, which is more clearly discernible in the Y-view. Posterior dislocations are commonly caused by high-energy impacts, as in this case. Since the ideal “second plane” (axial shoulder view) was not feasible, a “Y-view” (scapula tangential) was performed and is shown here,. The beams of the Y in this image are the body, acromion, and coracoid. The intersection of the Y corresponds to the glenoid, which is not clearly visible in this view but can be well localized by referencing the mentioned components of the scapula. How to orientate in this view: In the left of the right image (from the patient’s perspective) is dorsal; the right of the right image indicates ventral.
What happened?
The findings suggest a dislocation of the shoulder, likely a posterior luxation. (usually the humeral head dislocates in the opposit way).
Two images: 1.07a: above ap ; b: below Y Aufn.. Left the accident; Righ; after reposition.
vorher means “before”
nachher means “following treatment”
Posterior dislocation of the shoulder joint.
This is less common than anterior dislocation but a frequent source of misdiagnosis.
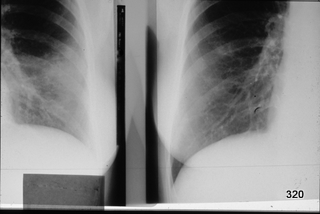
In the upper of the two following images, the standard projections before and after reduction are displayed side by side. Before reduction, the silhouettes are absent, whereas after reduction, the physiological alignment is restored.
Below these two images, there are two more from the second plane, also known as Y-views, demonstrating the position of the humeral head in the second plane: dislocated on the left, reduced on the right.
The second plane requires a shift in perspective.
In both images: left = dorsal; right = ventral (see red markings).
Conclusion: The humeral head is displaced posteriorly relative to the glenoid (intersection of the Y).
After reduction (right image), the humeral head returns to its physiological position, lying at the center of the Y.


C. Continue X-Ray Quiz 8-10
Image 1.08: 74-year-old woman, fell on ice. Multiple contusions, significant but not yet characteristic pain findings. – What is your visual diagnosis?
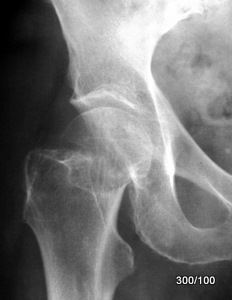
Hopefully, you refused to make a diagnosis due to an incorrect X-ray examination!
Non-diagnostic projection due to pronounced external rotation misalignment (as is often the case with anxious and pain-ridden patients; they let their arms and legs hang, resulting in external rotation positions in the hip joints). Next image will be very helpful!
Image 1.08b: Proximal femur a.p. depending on its rotation (Drawing WGHS from Schmitt and Kurtz, Orthopedics):

Starting from a neutral position (0°) and moving continuously into external rotation, the trochanteric mass appears increasingly larger (####), the femoral neck seemingly shortens, and the collum/diaphysis angle becomes steeper. See +30°, +40°: In cases of strong external rotation, the image is dominated by the trochanteric mass (red rhombus line ######).
With continuous internal rotation, the trochanter appears progressively smaller, eventually leaving only the small pit (marked with a red *). In this internal rotation, the femoral neck also appears shorter, and the collo-diaphysis angle seemingly steeper.
This information can be applied to the next patient.
As a standard, a neutral position with up to –20° internal rotation (lateral edges of the feet perpendicular to the table surface) is indispensable.
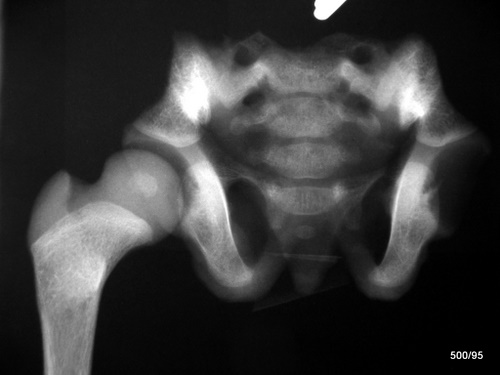
Image 1.08c: New case. 47-year-old woman. Rear-end collision, unbelted. – X-ray of the right hip a.p.
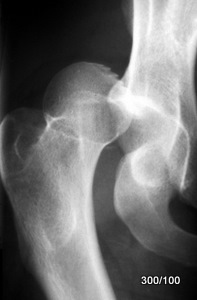
The red asterisk * in sketch b marks the prominent pit at the insertion of the external rotators, which is only visible with strong internal rotation.
Using the schema (08b), everyone can solve the question: Is this dislocated femoral head positioned anteriorly or posteriorly to the hip joint? (Of course, the mechanism of injury and clinical presentation give us an idea of the likely answer.)
In this case:
The femoral head is positioned posterior to the acetabulum. –
One of the various proofs is as follows: The femur exhibits a marked internal rotation deformity; this alignment is consistent only with the femoral head being posterior to the hip joint. This fully matches the clinical presentation.
(What other evidence could be used?)
Image 1.09: 70-year-old patient; abdominal colic for 48 hours. Now fever; “rigid abdomen.” History: gallstone. Previous examination: X-ray abdominal overview one year ago.
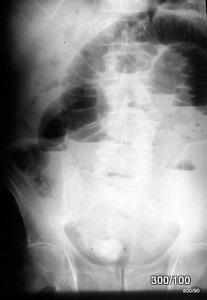
Abdominal overview in standing position (100 kV).
We discussed quality and technique in the course. –
Can a diagnosis be made?
Important question: What did the abdominal overview from one year ago show? At that time, the calcified structure in the pelvis was absent, but there was a calcified shadow in the gallbladder region.
Did you identify the pathological air in the bile ducts?
Our French colleagues use the term “trop bel image”: The common bile duct is visible along with its branching. Why is it darker than the surrounding tissue (hypodense)? It is filled with gas.
Summary:
Perforation of a very large calcified gallbladder stone into the intestine. Aerobilia.
Gallstone ileus with multiple air-fluid levels in the small and large intestines.
Image 1.10: 58-year-old patient. Excerpt from an abdominal X-ray examination. Clinical context is initially withheld. What can be deduced?
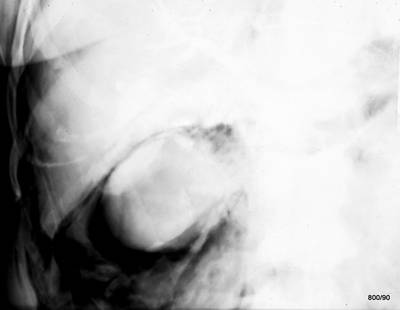
What makes the kidney, lower liver edge, and psoas stand out so unusually clearly? The French term “trop bel image” applies here; something appears much “nicer” than it should. There must be an underlying pathology.
Indeed, the mentioned silhouettes are seen with “pathological” clarity: even the liver contours, kidney shadow, and psoas shadow. What causes these unusual silhouette signs? Are they not all located in a specific anatomical space?
Diagnosis?
The organs are surrounded by air. Only a perforation—or perhaps a gas-forming infection—could allow air to enter the space around the organs. The clinical context provides additional clues.
Retroperitoneal perforation (in this case, a complication during endoscopic retrograde imaging of the duct systems: ERCP).
The contrast-filled bile ducts are difficult to identify. Fortunately, this complication is rare; however, when it occurs, immediate diagnosis is crucial, not least to avoid exacerbating the lesion.
A. X-Ray Quiz 11-12
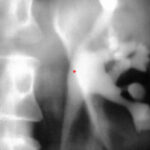
Image 1.11: 54-year-old patient, renal colic; urography with intravenously administered contrast medium. Indication?
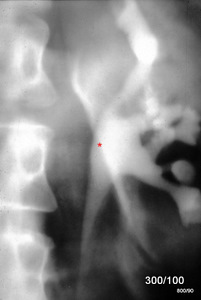
The image above demonstrates a specific—and now rarely used—technique: conventional X-ray tomography as part of an excretory urography in the context of suspected renal colic.
– Diagnosis?
Hydronephrosis of the contrasted renal pelvis and calyceal system. Confirmation of the sonographic diagnosis. Additionally, contrast medium accumulation along the medial contour of the kidney = extravasation due to fornix rupture.
Fornix ruptures occur due to pathological pressures in the renal pelvis and calyceal system (NBKS), such as:
- – Likely from overly forceful retrograde filling,
- – Obstructions (usually stones),
- – Or tumor-related drainage obstructions, both of which are often combined with intravenous excretory urography, where pharmacologically induced high excretion pressures can lead to rupture at a vulnerable spot of the NBKS.
There is also a pyelolymphatic or pyelovenous reflux, which temporarily causes the vessels to appear colored.
In our case, the course was uncomplicated; a ureteral stone passed, and the kidney fully recovered.
Image 1.12: Age: 42 years; post pelvic fracture. Osteosynthesis. X-ray – pelvis a.p., Quality? Slight left rotation (slight obturator position on the right; corresponding slight ala position on the left).
Question to exercise our spatial imagination: Was the plate inserted from the ventral or dorsal side?

Image 1.12b: If the plate is screwed in dorsally, with a left pelvic rotation (= “right side of the body raised”), the screws should appear elongated and pointing towards the viewer;

They do. The screws are inserted dorsally.
Anyone who thought the plate was screwed onto the pelvic skeleton ventrally has fallen victim to an old psychological error: Anything that is bright seems to be “closer to the viewer,” while the darker areas seem farther away from the viewer.
This plate lies dorsally, and the screws in the a.p. image (1.12a) point towards the viewer, i.e., ventro-medially. Since we conventionally look at the patient and the X-ray from the front, some viewers mistakenly think the plate is ventral. This is incorrect.
To put it another way: Image 1.12b shows one of the ways (without judgment) in the radiological process:
With left rotation, the screws appearing to run away from the viewer in image 1 shorten and may even project laterally from the plate.
But they elongate. We are looking at the screws from the side.
Thus, these screws in 1.12a are coming towards us; they are inserted dorsally.
Of course, this question can be solved anamnestically and by inspection. A ventral osteosynthesis would not be so laterally positioned. But even then, mistakes can occur.
This is an anatomical and psychological problem that frequently arises in imaging.
There are also other, more sophisticated proofs. One example comes from the author:
Imagine standing on the socket head of the lower screw in Figure 12; then observe the deeper edge serration on the left side compared to the right side of the screw contour. This proves that the screw is coming towards the viewer, not moving away. (Interested? More to come soon).
B. 1 – 2 : kV, mAs, Scatter Radiation
Some parameters in radiology: Kilovolt (kV), milliampere-seconds (mAs), scatter radiation, contrast
Image 2.1a + b: Hofkirche Dresden. Twice

Image 2.1b: If you were to hang one of these two images in your waiting room, which one would you choose?

Why does a majority choose the lower image?
We instinctively prefer the best contrast. Contrast provides us with the illusion of spatial depth; it helps us break free from the constraints of a two-dimensional image and creates a three-dimensional impression. (Whether this impression is accurate is another question.)
In the early days of X-ray diagnostics, contrast was overvalued; even in later decades, radiologists were reluctant for a long time to produce low-contrast images for lung diagnostics. These low-contrast images, however, are much better suited to handling the density differences of the “object”: the mediastinum is still penetrated, but the lung periphery is not rendered in extreme blackness. This allows details to remain visible even in the otherwise very bright mediastinal and heart shadows. The lung periphery does not sink into deep blackness, which might obscure some details.
Additionally, this “hard-beam technique” significantly reduces the radiation dose.
Image 2.02a: Important Image. In X-rays, different “light” options can be chosen:

Why do we move from “contrast” to kV?
kV is an important factor for contrast.
For example, 100 kV (in primitive terminology: “hard”). This radiation is less attenuated in tissue, which results in fewer biological effects but also less distinction between structures of varying thickness and density. Consequently: low contrast.
50 kV (in unprofessional slang: “soft”). This radiation is more strongly attenuated in tissue; it creates greater contrast but, due to the higher dose requirement, also greater biological effects.
Why a higher dose? This radiation is more strongly attenuated in tissue. More is needed to achieve the required dose on the film side/image intensifier side.
In the early decades of X-ray application, low kV was highly valued due to the impressive contrasts.
Today—and this is a key part of radiation protection training—we advocate for higher kV and accept a certain reduction in contrast (more gray-on-gray). This has been codified into government regulations: we are required by the guidelines of the German Medical Association to adhere to “minimum kilo-volts,” and this is monitored by medical authorities. In Bavaria, these authorities are part of the State Medical Association, while in Hesse they fall under TÜV.
The important connection explained again in another way:
On the film (or storage plate or image intensifier), a certain dose is required. Why? The signal must exceed the noise by a specific factor; this factor is not given but must be determined through informed decision-making.
– With “soft radiation,” a high surface dose must be applied on the tube side to achieve this necessary dose on the film side.
– “Harder radiation” effectively “sails” through the object with less hindrance; it requires a lower dose on the tube side to reach the required dose on the film side.
“The critical area regarding radiation protection lies on the tube side!”
In this area, surface dose and/or incident dose are measured. Both are closely related; which of the two is slightly larger depends on specific conditions.
Finally, a very practical question (for various specialty board exams):
What kV is used to take an image? (If this is not entered into an automatic system.)
– 120 kV for the thorax and abdomen,
– 70 kV for the bony body axis, from the skull to the pelvis (except for the lateral lumbar spine, where 70 kV would still be too low; 90 kV is better).
For those with no knowledge at all, they can say: Everything with 120 kV. This is not entirely wrong; at least they can cite radiation protection. However, this would produce very low-contrast images throughout the body axis. In the periphery of the extremities, the images would be aesthetically and diagnostically subpar.
I advise against saying: I do everything with 70 kV; this approach might have passed in 1950. Today, they would likely be told their method is irresponsible, and a reappearance before the examination board would be required.
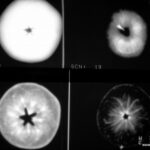
Image 2.02b: Two X-ray images of a grape (Sylvaner)
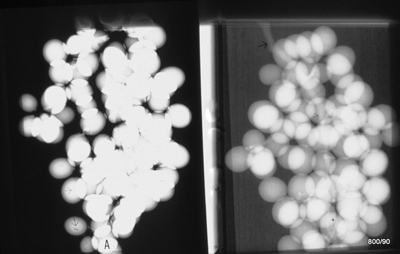
A Riesling grape often does not have such beautiful berries.
– One was taken with 28 kV (“so-called soft” radiation; so soft that it is not used for bone imaging in humans).
– The other with 70 kV (already relatively “hard” radiation for this smaller object).
In which of the two images was the “softer” radiation, i.e., 28 kV, used?
The radiation protection course, e.g., in Würzburg, is particularly important for you if you said “right”! If so, you need to fill some gaps, and I need to ask myself why I wrote several pages for nothing.
Left is the image taken with “soft” radiation. It produces these characteristic high-contrast images!
Major drawbacks:
- High dose,
- Difficult to expose; prone to overexposure or (as here) underexposure.
However, “soft” radiation (unfortunately?) also has advantages: Beautiful contrasts; see the depiction of the grape seed (thin arrow at the bottom left). Why is such a seed black?
Fat content: “Fat in water” = relatively less dense = more radiolucent = appears black in the image.
Right image = “hard” radiation: “Gray on gray”.
Much lower dose! – Easier to expose. – Better handles objects of varying thickness.
Why do many people answer this question incorrectly?
– We’ve heard that “hard” radiation is good; – the left image appeals to us due to its (exaggerated) contrast.
Both statements are combined into a misdiagnosis.
Image 2.03: Identical kV on the right and left!
One other parameter is varied; only one! Which one?
“The time” is a correct answer;
“mAs” is also correct.
### Why are both answers correct?
An (X-ray) machine is characterized by specific milliampere (mA), which represents the device-specific current. When this mA is applied for a certain duration, it results in a useful quantity, the product of milliampere times time in seconds = mAs.
mAs is proportional to the dose.
In simpler terms: Double the time = double the mAs.
Even more straightforward:
The difference between the two images: In the right image, the exposure button was pressed twice, resulting in double the dose.
2.4. Collimation
The second most important piece of information in my part of the radiation protection course is the explanation of the importance of collimation (the useful beam bundle) to the region of diagnostic interest. This is a complex topic; there are skilled professionals who have not fully understood it.
Image 2.4a: Often, collimation is insufficient, meaning: wasted dose and lost quality

Here, improper centering occurred, and the collimation on the right side of the skull was (exceptionally) exaggerated. The failed image demonstrates the significance of scatter radiation. The hope is that with forced collimation, no radiation will reach the right outer ear. However, this hope is overly optimistic. Observe the image: scatter radiation creates a clear depiction of these soft tissues.
Thus: Even with good collimation, scatter radiation exists. It cannot be entirely avoided; however, it should be minimized through proper collimation because it becomes excessive when this rule is neglected!
With no collimation,
we experience much more of this disturbing, unnecessary radiation.
Why is it “disturbing”?
Because it affects the entire image and deteriorates its overall quality.
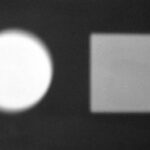
Image 2.04b: A phantom (water tanks + coin) photographed twice; the left and right halves of the image were taken with identical kV, mAs, and identical distance. What was varied?

Many have argued: identical kV, mAs, and distance must mean the dose is the same! After all, the X-ray tube delivered exactly the same output in both cases.
It cannot be that the right image is completely overexposed (black)!
Yet it is! There is a clear explanation:
In the left part of the image: careful collimation.
On the right: no collimation.
### The consequences of missing collimation:
– A drastic increase in dose (due to the excessively large “irradiated” volume).
– A loss of contrast caused by scatter radiation.
### What do the numbers in the image mean?
They represent measurements of film darkening using a densitometer.
This device is familiar from the quality control of chemical development processes. It provides dimensionless numbers:
– **1**: The intensity of a light source is reduced to one-tenth by the darkened film.
– **2**: The intensity is reduced to one-hundredth.
This is a logarithmic representation of film darkening.
C. 1 : Rules for X-Ray
Classical Rules: Summation Effect, Silhouette Sign
First, 3.1 Summation Effect
Image 3.1a: In this illustration, all parameters—kV, mA, distance, and “film-side amplification”—were kept constant.
The material is “apple.”
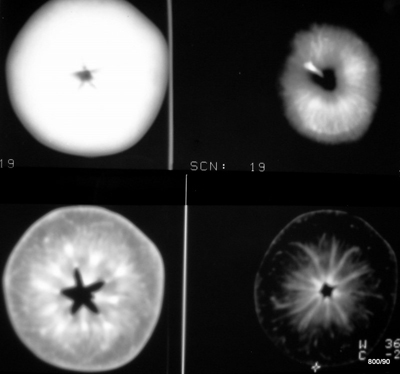
What was varied?
“The thickness of the object” is the answer.
Top left: Whole apple;
Bottom right: A slice from the center;
Top right: (stem-near) third;
Bottom left: (middle) third.
Why does the apple slice show so much structure?
It is a two-component system of air and “pulp.” The ratio of the two components varies greatly across the structure. The apple is a bluff; its volume is inflated with air. Nature wants to make it appealing.
Figure 3.1a is the classic representation of the summation effect. I was inspired by Pantoja for this idea—thank you, Henrico!
The silhouette sign is also illustrated. When the boundary between the apple and the air aligns with the direction of the X-ray beam, a sharp image is produced.
The terms summation effect and silhouette sign are explained and illustrated in detail on this website in articles 04 through 07, using examples from the human pleura.
X-rays are attenuated more as the thickness and density of an object increase.
Attenuation means less film darkening, resulting in brightness in the image.
(Paradoxically, in radiology, we refer to something bright in an image as a “shadow.” This terminology originates from the old fluoroscopy technique.)
A practical example of the summation effect: a stack of 10 coins creates a brighter spot than a single coin.
Classic misdiagnosis: A large lung metastasis appears “brighter” than a smaller one. From this, one should not conclude that the larger one is calcified. This mistake occurs regularly.
Image 3.01b: Chest X-ray. What obscures both mid- and lower lung fields? Fact or artifact? – Quality?
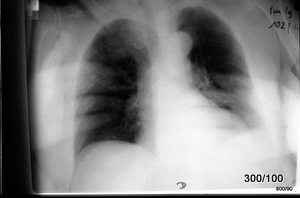
If the last image gave you a “headache,” this one should be much easier.
A significant application error: Obscuration of the thorax caused by both hands.
Why are the finger bones barely visible? Due to motion blur and the use of 100 kV; the relatively “hard” radiation that represents differences in atomic number (calcium) less effectively than differences in density.
There are additional quality defects:
Completely inadequate collimation.
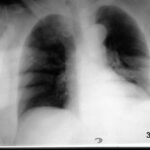
Image 3.01c: 46-year-old man; mild cough and low-grade fever

The term “bright lung” is a traditional phrase and means that one lung—here the left—is too black. This paradoxical terminology can be frustrating.
Radiologically, the left lung is a bright area (bright lung); but logically, this lung appears black!
The right lung is radiologically obscured. Logically, this lung is relatively bright. Regardless of the terminology used, certain diagnoses come to mind:
Could there be overinflation of the left lung, perhaps due to a foreign body in a bronchus? Or could there be pathological obscuration on the right, such as a right-sided pneumonia?
In this case, the diagnosis was made easier by observing the patient directly.
Poland Syndrome
The patient had an uncomplicated infection, persistent enough that someone deemed an X-ray examination necessary. The referring physician could have pointed out the thoracic asymmetry but assumed it would not be overlooked.
In the right lower field, the vessels appear slightly more prominent compared to the opposite side, possibly indicating mild prominence of bronchial structures consistent with peribronchitis. However, there is no air bronchogram, which is often typical in pneumonia.
The image can be interpreted as follows:
The right lung is overlaid by a thick soft tissue mantle (a well-developed pectoralis major muscle) = summation effect.
On the left side, however, there is a thinner soft tissue mantle due to aplasia of the pectoralis major muscle, accompanied by other signs, such as short fingers (brachydactyly) on one hand, indicative of Poland Syndrome. This condition was described by an English surgeon in the 19th century. Often, the nipple, as well as the major pectoralis muscle, is absent; in this case, our patient’s presentation does not entirely match the original description.
Our patient experienced no limitations in daily life and had compensated well for the changes. The greatest risk is misinterpreting a chest X-ray. This can be avoided by examining and talking to the patient. Indeed, the patient noted: “Whenever I have a chest X-ray, there’s always a debate about whether I have pneumonia on the right side.”
Typical negative summation effect: Due to reduced soft tissue overlay, the left lung appears darker. Similar findings can be observed in cases of paralysis or arm amputation, where the corresponding lung side may appear more transparent than the other.
If there were truly a unilaterally “bright lung” on the left side, it would be an alarming sign, potentially indicating a bronchial foreign body.
The position of the heart and mediastinum supports the interpretation of a normally aerated left lung. However, this argument alone is not conclusive.
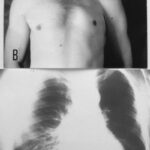
Image 3.1d: 2x X-ray, lateral skull views.
“A” 34-year-old man with severe head and throat pain.
“B” Healthy patient for comparison.

Image B is a normal finding from a peer of the same age, included to help guide the diagnosis. This comparison should assist in reaching a diagnosis, especially since the patient has already consulted multiple doctors. This conventional X-ray examination alone would have sufficed to identify at least a significant partial finding.
Initial question:
Why is the lateral skull in Image A poorly positioned?
Key pathological finding in Image A:
What is the major abnormality evident in Image A? This is the central question that requires further investigation, as the lateral skull in Image A deviates significantly from normal anatomy, suggesting a clear pathological condition.
Not optimally positioned laterally: The mandibular condyles and external auditory canals are not projected on top of each other.
However, this does not explain the critical finding:
The complete opacification of the sphenoid sinuses (and a suspicion of a soft-tissue-density mass in the posterior nasopharynx).
Replacement of air with “soft tissue”: a classic summation effect.
Histology from the mass in the nasopharynx eventually revealed the disease that had expansively occupied the large pneumatic cavities: Hodgkin’s disease of the sphenoid sinuses.
C. 2: X-ray Rules Continued
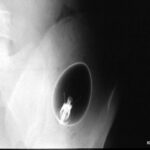
Image 3.1e: Abdominal X-ray (Detail).
32-year-old patient; abdominal cramps.

The foreign object projected over the ilium appears to be the glass component of a light bulb.
**Question from the surgeon:** Is this object located externally or actually within the abdomen?
The first step is to carefully examine the patient and ask a few cautious questions.
This inspection of the patient is supplemented and expanded by radiological evidence, which is based on something that all readers of this article are familiar with: the knowledge of the summation effect.
Foreign body clearly intra-abdominal.
If the light bulb were located outside the abdomen, the total attenuation of the object would have added to that of the abdomen.
The light bulb would appear slightly brighter in all areas, but certainly not darker, than the surrounding abdomen.
However, since the light bulb displaces soft tissue, it reduces the attenuation within the image. In its center, it reduces more attenuation than it adds through the glass. Only in a narrow rim does it add more than it takes away. This results in the thin, bright edge contour visible on the X-ray.
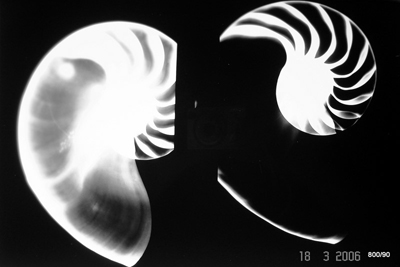
Image 3.2a: Why can we see the uncalcified cartilage of the proximal femur on the right side so clearly in this child?
This was meant to be a slightly easier question: The image is of a specimen. The cartilage is surrounded by air rather than soft tissue. This makes the cartilage appear significantly denser than its surroundings, giving it a clear silhouette. This is highly unusual for an X-ray of a living child, as the cartilage appears relatively bright compared to the air surroundings. (Here, I refer to “bright” in the ordinary sense of the word, not the historical radiological terminology, where “brightening” refers to something dark on the X-ray image.) However, it is not as bright as the already calcified bone core in the femoral head or shaft.
Everything in an X-ray image is “relative.” To repeat: If the cartilage were surrounded by soft tissue, it would not stand out (no silhouette), and the small density difference compared to the soft tissue would not be noticeable on an overview image. It would not appear relatively bright.
What wonderful possibilities do we have at this age with ultrasound?
Image 3.2b: 48-year-old patient; caught awkwardly in the seatbelt while exiting the car.
The patient is in pain and unable to bear weight. Lateral X-ray of the talus.
The distal fibula and medial malleolus appeared clinically unremarkable.
The lateral X-ray is atypically collimated and focused on the talus.
### Is there a guiding clue from this (poor) image alone?
A close inspection may reveal subtle indications of alignment, bony irregularities, or joint space narrowing that could point to a specific diagnosis, even if the imaging quality is suboptimal. A careful assessment of cortical integrity, articular congruity, and any signs of effusion or soft tissue swelling is essential.
Yes! The silhouettes of the talar head and the navicular bone do not align properly. Articulating silhouettes must harmoniously match everywhere, including here in the Chopart joint.
This is a case of a dislocation. (For those who studied Case 1.05, this diagnosis will come easily.)
We will take a second view and possibly perform a CT scan; will the latter assist the surgeon with repositioning and fixation?
C 3. Importance of the “x-ray in two planes”
Image 3.3: Lateral X-ray of the elbow.
Left: Accident;
Right: Correct placement of joints

The axis of the radius does not intersect the (here unfortunately somewhat poorly defined) center of the capitulum humeri in the left image.
This indicates a clear dislocation of the radial head.
Right image: Post-reduction, with proper joint alignment. A line drawn through the middle of the radius passes directly through the now more clearly visible center of the capitulum humeri.
The importance of the second plane can be illustrated with various examples: elbow, wrist, ankle, and proximal femur. This is further demonstrated during the course with additional cases.
Image 3.03a: The Importance of the “two planes in Radiology” Using a Mathematical Model. Here we see the first pane.
In just one plane, the X-ray method often fails. It is unclear how the structures are actually shaped. Is it simply due to a lack of practice and imagination, or does the X-ray method itself have inherent weaknesses, which are demonstrated here?
Image 3.03b:
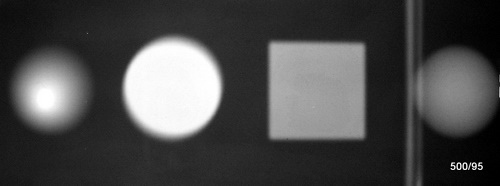
The second plane provides clear resolution. The bodies are : cone, cylinder, cube, and sphere.

Image 3.03c:
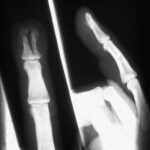
Injury with an axe.
X-ray of the finger in two planes;

Of course, the clinical findings take precedence, a point emphasized repeatedly in the course.
Let us examine the X-ray without considering the clinical context:
The lateral view alone (right image) would have led to a misdiagnosis.
The a-p view (left image) reveals the extent of the direct bony injury.
These are just a few thoughts for the course—
to inform, deepen understanding, discuss, and correct.
The organizers of the course in Würzburg will be happy to welcome you to the beautiful Welzhaus (Klinikstraße), near the Röntgen Memorial Site, the location of the groundbreaking discovery.