Artifacts III, Chapter 6.1: Distinction Between Artifacts and Facts of Physics, Projection, or Variants. Images 6.01 – 6.11
13 Physics and Pathology Misunderstood as Artifacts Due to Ignorance
In the previous two articles, the question was raised: What causes problems in X-ray imaging? What leads to errors? What causes diagnostic issues, pitfalls? A large group of culprits was quickly identified: These are artifacts, artificial products that, for various reasons, can discredit “Imaging Diagnostics” in terms of quality. A code, a scheme was defined in Article 10 for the various causes of artifacts. Recognized as the Schmitt-Buxbaum Code. This allows you to search for specific artifacts (using Ctrl F).
In the study of “Artifacts in X-ray Images,” it became clear that defining them can be difficult. Sometimes, they are not technical or human errors, but rather unusual findings and misunderstood physical phenomena. There is a grey area, which will be explained using additional images.
In this chapter, we move away from artifacts and focus on natural phenomena (physics). It addresses phenomena that might be mistaken for artificial products if not understood. This juxtaposition is helpful for colleagues who are delving into this subject. For experienced individuals, it serves as a – hopefully amusing – review. Several outdated diagnostic techniques are shown, which may add extra confusion for the viewer.
Specific “physics” features that need to be diagnostically classified:
a.) Physical Phenomena
b.) Physiological Phenomena
c.) Projection
d.) Anatomical Features (and/or Variants)
a. Physical Phenomena can lead to apparent distortions in images. Something may not be represented as we expect. It is easily assumed that something has been “artificially degraded,” which is typical for artifacts. The error here does not lie in undesirable conditions during the examination, but is of a principled nature. A seemingly “poor” image quality may arise because nature cannot be tricked. The error lies in the viewer’s ignorance.
Classic Examples:
– X-rays are generally fascinating. However, in some cases, the procedure can be very disappointing, i.e., something expected is not shown at all or is very poorly represented (e.g., 4 bodies…). Often, the “second plane” helps in this disappointing case; it provides clarity (axe injury, hip joint 2, planes). Occasionally, two planes are insufficient, and additional images or even a tomographic technique are required (see radial head, navicular fracture).
– Large lung metastases are whiter than smaller ones; this is the “summation effect.” If this is not understood, a “calcification” of these larger metastases is assumed.
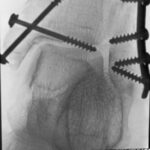
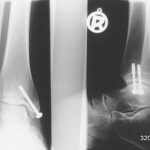
– The number of screws (foreign bodies) is incorrectly stated because one screw covers another (e.g., ankle joint case).
– Geometric Magnification Factor can be overestimated (1.06………….) or underestimated (1.07b….).
– Geometric Blurring. Previously used in certain techniques to suppress overlapping structures. – In today’s X-ray technology, blurring can indicate an exposure time that is too long and thus too low Kv.
– Beam Hardening, discussed in the last article. An article by the author addresses this. The fantastic possibility of using CT to measure radiation attenuation in specific tissues is distorted by the proximity of bone (even more by metal implants). The effect arises because we usually don’t use monochromatic X-rays in CT but a spectrum of radiation.
– Partial Volume Effect. Known through computed tomography (CT). (Of course, this has always existed in X-ray, where it’s called the summation effect): The volume element (voxel) in CT can capture multiple characteristic tissues. The resulting image of this voxel measurement is the pixel; it results in a mix of the captured components.
– Statistical Disturbance. Densitometry over too small a region is disturbed by statistical noise and is not sufficiently representative.
– Motion Artifacts disturb and distort the results of densitometry.
c. “Physics” also includes the non-standard projection (see setting technique).
d. Also, anatomical features must be distinguished from artificial products. Such variants of physics are categorized in this chapter. There are classic disputes in radiology history about whether a certain change is a congenital variant or a pathological process. If you’d like to study an example and the process of clarifying the argument, refer to 03 “Fracture Healing.”
It is the aim of this article to draw clear boundaries here: Physical phenomena should be understood and not mistaken for artifacts.
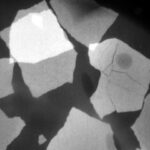
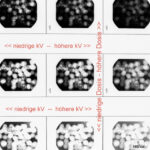
Fig. 6.01: Dependence of the X-ray Image on Both Dose and Voltage (kV)
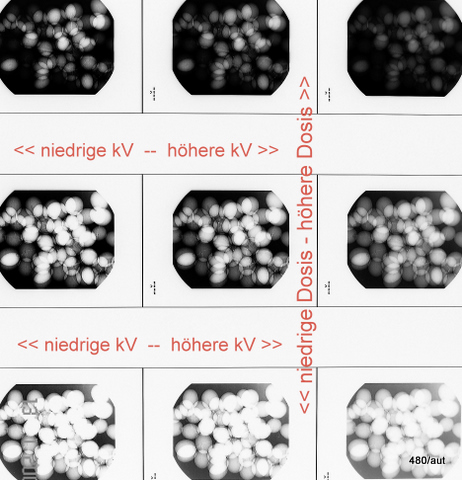
6.01: During the radiation protection course in Würzburg, the instructors discussed how this question could be represented in an image.
I present my own solution. However, it is a digitally created image, so to speak, without any special effort. Grapes from the Sylvaner wine at the Julius Hospital. (My hospital has the uniqueness that it also produces wine).
Above are the overexposed images, below are the underexposed images.
On the left are the images with low kV: very high contrast, on the right with higher kV (low contrast, but better object field).
Are these images good?
Mostly no! We have to discard almost all the images! The lower ones are too bright, the upper ones are too dark. On the left, there is too much contrast (i.e., too bright and too dark in the image).
The image in the middle right is acceptable. We learn from this: A specific object should be X-rayed with the correct dose and the correct radiation quality (= kV).
Correct kV also means, from a radiation protection standpoint: not too low kV.
A too low dose is also a source of error because information is lost.
Too much dose is, of course, bad for radiation protection.
Experts will suspect that these images are “faked” (“fake”): They are simulated in the computer; deceptively similar to a variation of kV and mAs. In “100 Years of X-ray, 100 Riddles” by WGH Schmitt, this is demonstrated using the example of a lateral cervical spine.
The good news: In the digital image, errors can be compensated by darkening and contrast (= window center and window width). It’s as if we could retroactively correct Kv and mAs. Unfortunately, this has its limits. Where dose is missing, it cannot be supplemented in the computer.
This is very unfortunate because otherwise, we would take more images with drastically low doses and “improve” them later. At low doses, the image signal breaks down against the noise (SNR).
Despite modest successes in dose reduction, we should be very happy that digital X-rays are even possible; that digital X-rays exist, and that we are constantly improving them.
The big missed opportunity is that the legislature has not required that every image states the dose with which it was taken. Technically, it’s no problem. The administrative and financial effort is minimal.
Innovations in radiation protection have never come from the users or the industry. – The legislature would have had to establish this against the resistance of the users and the industry; a difficult undertaking.
Fig. 6.02: Medical History. Comparison of Different Radiation: 50 and 75 kV “Hardness” in a Left Pneumothorax and Pulmonary Edema.
Left underexposed, right overexposed.
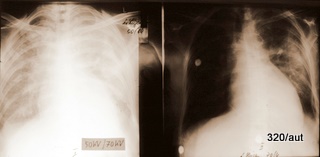
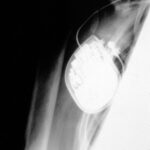
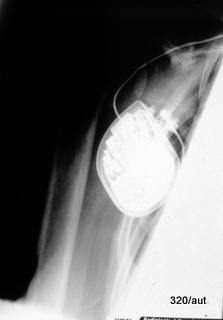
Fig. 6.03: Overexposed (too dark) X-ray of a Fracture of the Humerus. How could the exposure error occur?
6.02: In this patient, there is a very short follow-up. It would be inappropriate to intentionally create such poor images for comparison. Both kV values are considered too low by today’s standards and would lead to consequences from the medical authorities.
This medical historical example is particularly valuable for educational purposes because of the quality issues.
The 50 kV image on the left is underexposed and therefore too white (bright in the common sense). This happens especially easily with low kV values. The additional lung edema is almost exaggerated in its representation. Partial obliteration of the diaphragm contours. Mantle-shaped pneumothorax on the left side.
The right image with 70 kV is overexposed and therefore too dark.
The lung consolidation is most pronounced in the area of the partially collapsed left lung.
Problem with such erroneous parameters: distinguishing between artifact and pathology, as well as quantifying the pathology, becomes difficult.
6.03: Subcapital humerus fracture. The conditions for the failure of this image are physically understandable: Due to poor centering on the humerus, the measuring chamber (part of the ionomat) was positioned over the pacemaker unit.
As a result, the ionomat reports too low a dose during exposure and selects too high a tube current to compensate.
Classic error of automated exposure (It allows the Kv to be freely chosen, taking away our control (it would be better to center more laterally and higher) over the mAs. In contrast, with “free exposure” we choose both freely.)
There are two possible correction methods that can be combined:
Correction of the settings and/or switching to manual exposure settings, as the ionomat is overwhelmed by the anatomical conditions (fracture) in this case.
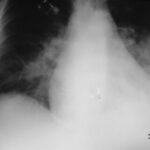
Fig. 6.04: Section of a Lateral Chest X-ray.
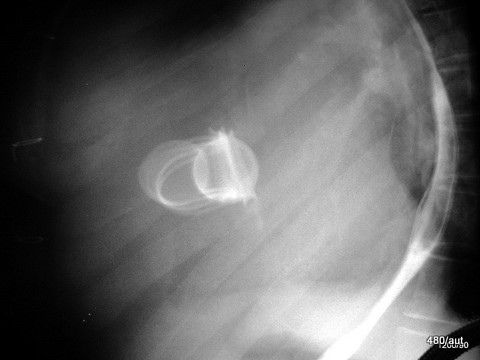
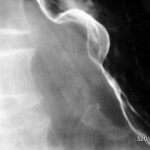
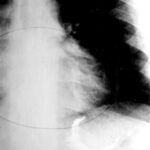
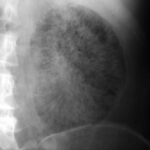
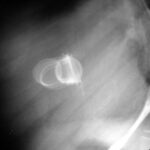
6.04: Old Starr-Edwards Valve. An analog model was constructed by Hufnagel in 1951. Such valves were manufactured until 2003. (See also Article 11). Modern artificial and also biological heart valves allow more blood flow and affect the red blood cells less.
What do we see? How can this be explained?
During a heartbeat, the valve and especially the movable ball are “illuminated” and become blurred. As long as the ball moves between the two phases of the heart, it is almost completely blurred. This blurring comes to a near stop in both systole and diastole. Therefore, the ball is relatively sharp in two positions (once in contact with the valve ring and in the other phase, free in the basket).
The valve ring moves only slightly.
The ball is depicted at the end positions of this movement.
Conclusion: This is not a double exposure, but rather a movement of the object with a stop at the beginning and end of the movement.
What initially looks like an artificial mess is the logical consequence of the valve construction and valve movement.
One can recognize the enlargement of the left atrium, which compresses the posterior heart space.
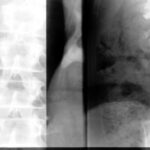
The posterior heart space is constricted. The fact that it is indeed the left atrium is recognized by the displacement of the contrast-enhanced esophagus.
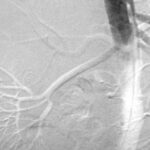
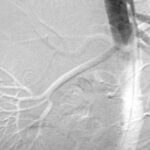
Fig. 6.06: Contrast-enhanced Imaging of the Abdominal Aorta. Catheter Angiography
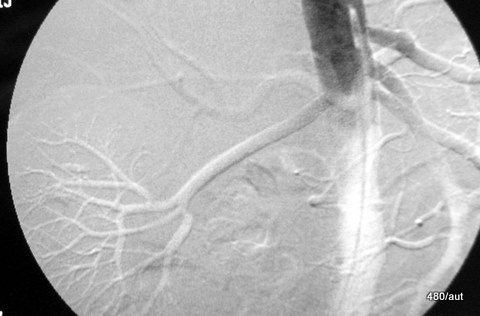
6.06: The puncture site is an artery in the right groin, and a pigtail catheter is placed in the upper abdominal aorta, with contrast agent: Solutrast 370.
No stenosis of the abdominal aorta and its major branches. In particular, no renal artery stenosis.
Since modern, less invasive methods are available, this examination technique is used less frequently today (although it is required for interventional procedures).
Is the image remarkable? Is something “distorted,” artificially emphasized? Is it a mistake or intentional?
The image is a “digital subtraction.” An image not shown here is subtracted from another, also not shown image. Only the result of the subtraction is displayed.
These source images are referred to in technical jargon as the “mask” and “filling image.” In the source image used, some contrast agent (KM) has already been injected. The subtraction shows us: how much and where it has increased between the first and the second source image.
The trick is that no significant contrast was intended here, as the two images used for the subtraction are very close together: 0.5 seconds. This method is one of many ways in post-processing. The approach used here says a lot about the function: What changed in the image within fractions of a second? How far has the injected agent, the KM bolus, progressed in such a short time? This can become interesting in cases of vascular wall disease. Whether this “advance” is shown dark or light is irrelevant. The examiner has control over this in post-processing.
In the digital world, “dark or light” is a matter of setting. It is just as arbitrarily determined as whether current flows from + to -, or from – to +.
The temporal proximity of the mask and filling image dampens the contrast. Through this damping, another phenomenon becomes more prominent. This one also has an “artificial” character: The vessels are slightly shifted due to pulsation. This causes a “pseudo-relief”:
The arteries are dark on one side and light on the opposite side. A (seeming) spatial impression is created. In reality, this phenomenon does not contribute to spatial orientation.
The “spatial orientation” in conventional X-rays is notoriously problematic. Psychological phenomena confuse our imagination (pelvic screws, see 09 and 10 Radiation Protection). However, there is a “special technique of relief” that actually provides true spatial information (see Article 15).
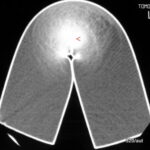
Fig. 6.07: Compression of a Foam Cushion in CT
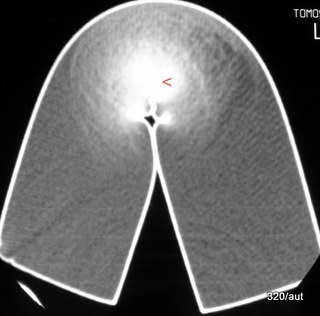
6.07: “Foam” means: The plastic is not pure, but loosened by a second component (here air).
So, a two-component system is present:
Air and plastic.
The “densities” of the two components (and their concentrations) contribute to the density of the mixture! (Component hypothesis, riddle 70 in 100 Years of X-ray, 100 Riddles)
a) Why does the cushion have this bright edge of about 1 mm thickness? Here, the material is not air-tight, so it is
– not a “two-component substance,” but a “pure substance with a correspondingly higher density (and atomic number).”
b) What does the bright spot (red arrowhead) mean?
At the bend of the cushion, the air component is reduced under pressure, which locally increases the relative proportion of “plastic.” Hence, the zone of stronger attenuation of the X-ray.
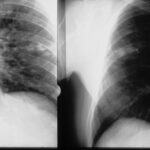
Fig. 6.08: The Right Half of the Thorax of the Same Patient is Symmetrically Opposed Twice. What is the Difference?
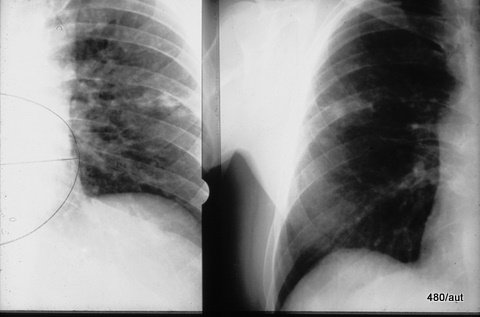
6.08: Both images show streaky white spots in the right middle field. Knowing the patient’s medical history, we can interpret this as a “residue,” as a healing stage of a past tuberculosis infection.
If we are unaware of the medical history, we would need to conduct some research to understand this finding.
Why are the two images so different?
The same lung half was taken in a lying and standing position.
Since there are images of the same patient both lying and standing, it is important to learn from them, even though one must critically assess the meaning of having two images.
The right half of the image was taken while standing: the worldwide standard.
The left half of the image was taken “lying down”, showing a higher position of the diaphragm; a wider mediastinal contour due to congestion of the superior vena cava (Cava superior). The vessels in the lung—primarily veins—are more filled.
This left-side image was taken for a heart volume measurement that was considered important years ago. The method required a chest X-ray in the lying position for standardization purposes. (Today, there are much better measurement methods for the heart).
If a “standing image” looked like the left image, one would suspect congestion (in both the large and small circulations).
Additionally, one would observe insufficient expansion of the lungs.
Overall, the lying image is physiologically inferior. It is artificially distorted. (See also Fig. 10b). The artifact likely lies in the inappropriate indication for the examination in the lying position. For an artifact to occur, something has gone wrong: technique, planning, interpretation.
Fig. 10a: The Summation Effect in X-ray Demonstrated on Eggshells
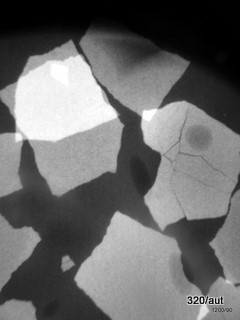
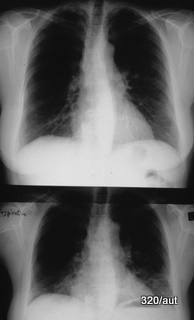
Fig. 10b: Chest in Inspiration and Expiration
6.10a: A beautiful demonstration of the summation effect. Fragments of eggshells are located in a gel. Where they overlap, the radiation attenuation is much stronger, and where they are distanced by fine fracture lines, these appear as lines of lesser attenuation. Individual air bubbles in the gel create a negative summation effect, appearing dark in the image.
6.10b: What distinguishes both thoraxes?
The key to the solution is the
different diaphragm position. Inspiration and Expiration.
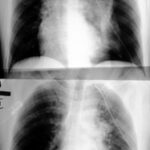
Above: Exhalation = Expiration
Below: Inhalation = Inspiration
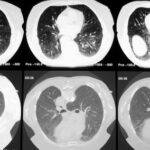
What stands out is the consolidation, especially of the basal lung sections during expiration.
Both images were taken due to a persistent suspicion of pneumothorax.
The image taken during exhalation has a slight advantage: Due to lung consolidation, the pneumothorax has relatively better contrast and is (I don’t know how often) better represented. Apart from this, such an image taken during expiration is diagnostically less useful and therefore of poorer quality.
Instead of this discussion, today one would immediately opt for a computed tomography scan.
In the broadest sense, expiration is an artifact; typical of an artifact is that it could lead to misdiagnoses. To avoid this, one must be very familiar with the peculiarities of an incompletely expanded lung. (See also the similar problem: “Thorax Standing/Lying”…)
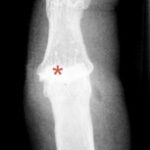
Fig. 6.11: Summation Effect in a Dislocation of One of the Finger Joints (Proximal Interphalangeal Joint)
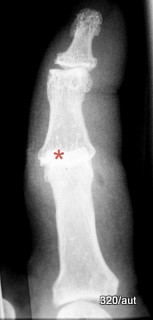
6.11. Dislocations are characterized in X-rays by the fact that the silhouettes of the two joint components, the head and the socket do not fit harmoniously with each other. They do not need to be pulled apart, but they can naturally “unharmoniously” overlap. This creates a pathological summation effect. This image is important for anyone starting in radiology.
One might rightly argue: the second plane would make the situation “foolproof” to understand. – That’s true, but it’s a different story.
(Overlooked dislocations make up a significant portion of radiological misdiagnoses.)
Fig. 6.12: Medical Historical Image. Late Pregnancy
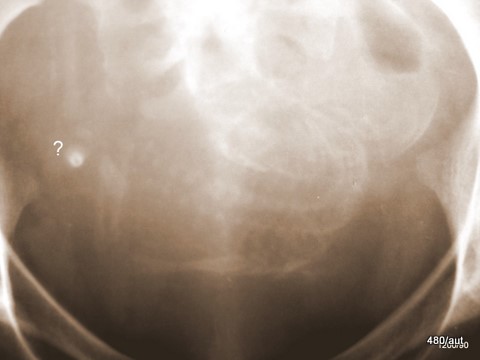
6.12. The image is shown to draw attention to radiation protection.
I have not experienced an intentional or accidental X-ray of a pregnancy.
Anyone who has already considered the summation effect in cases 6.10a, 11, and 13 should ask themselves: What is the bright ring-shaped structure marked with a question mark? An artificial product? No, a physical effect. The summation effect.
It is an axially projected leg bone. Even with the delicate tubular bones of the embryo, so much bone material is summed (due to this randomly created projection) that an intensely bright “ring-shadow” results.
Fig. 6.13b: The Summation Effect Also Carries Sources of Error
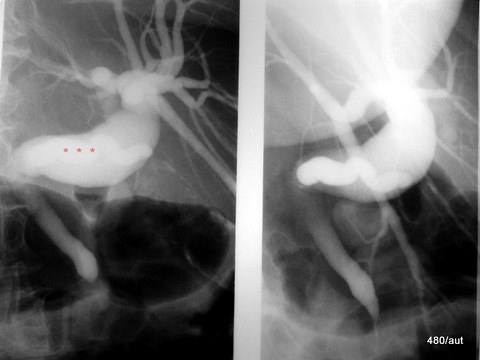
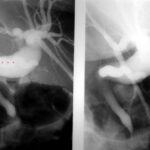
6.13 Left Image Half: The significantly enlarged common bile duct (Ductus choledochus) overlaps with the markedly enlarged cystic duct (Ductus cysticus). The cystic duct is barely visible, it almost disappears into the intensively contrasted choledochus.
Isn’t this a frightening phenomenon? One piece of image information is simply erased. We have always hoped that nothing could be hidden in an X-ray, that every part, no matter how deeply hidden, would contribute to the image. However, X-rays are not as infallible and “error-free” as we might have hoped.
A too low dose greatly promotes this covering-up. Here, the dose is not fundamentally too low; it is only dangerously low for such a thick and highly contrasted bile duct! Similarly, concretions in the bile duct can evade detection, just as the cystic duct nearly disappears here. Once the problem is recognized, it is already solved:
Right Image Section: Here, some physiological saline solution has been injected; the common bile duct becomes more transparent, and the cystic duct now appears very clearly.
To combat this insidious covering phenomenon, it helps to:
– Not use too low kV (which also benefits radiation protection)
– As demonstrated here, not use too high a contrast agent concentration (many fall into the misconception that “more” is always better)
– Regularly inject physiological saline solution
and flush the duct system.
– Observation during contrast filling, when little contrast agent creates a not too intense contrast.
– Observation (with pulsed fluoroscopy!) during contrast drainage.
Fluoroscopy has a purpose here. It is assumed that pulsed fluoroscopy and good image blending are used.
Fluoroscopy requires strict control, it demands
increased attention to radiation protection.
Two standard projections are sufficient for most skeletal images, but not for all (think of navicular or radial head images).
We see that the right balance is crucial. Too little or too much may be disastrous.
Fig. 6.14: Is the Sternoclavicular Joint (Red Arrowhead) Depicted Here?
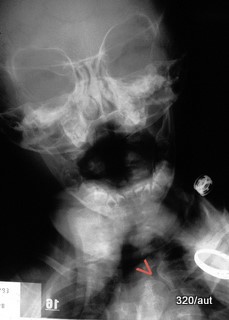
6.14. For a moment of relaxation, a less serious case:
No, an actual artifact has “sneaked in”:
Projection of the hand onto the neck/chest region. No
sternoclavicular joint!
In the rush to help an accident victim, a failed X-ray with a number of other errors was taken:
Apparently, the neck region of this child is overlapped by the hand of an adult helper. Red arrowhead: Metacarpophalangeal joint.
The examination was done about 60 years ago and was archived far from the hospital where I found it.
For the past 37 years, “Medical Authorities” established by government regulations have been monitoring radiological quality. In such a case, they would determine: X-ray examination failed, questionable indication.
Fig. 6.14b: One or Two Screws? A Finding Can Be Covered (in Bright Image Areas). Another Finding Is Not Visible.
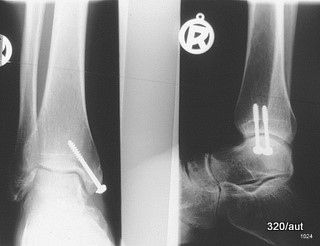
6.14b: The French use a saying from traffic psychology: “un train peut en cacher un autre” (one train can hide another).
A pitfall. But not “negligence,” not a complication created for artificial reasons, but a consequence of physics.
Therefore, this possibility of error cannot be compensated by better application techniques. It arises in the mind of the observer and can be corrected there:
“Knowing the error” opens the door to avoidance. Recognizing typical findings is a prerequisite for diagnosis.
Also, the number of foreign bodies is often reported too low; three are removed, but a fourth is still present upon follow-up.
Fig. 6.14c: How far is one of the two screws inserted medially in the upper ankle joint?
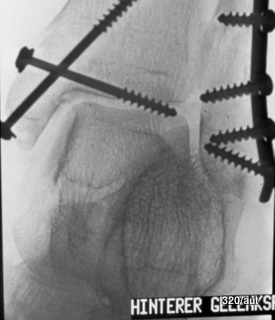
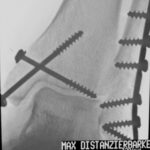
Fig. 6.14d: Under fluoroscopy, a projection was obtained and documented with the widest distance of the screw tip from the talus! The thread near the tip reaches the talus compacta.
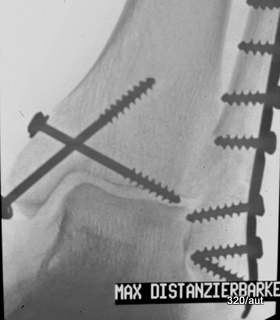
6.14.c + d: Here, as always, the clinical context is very important.
(The images are inverted: screws and bones appear dark!)
If there is suspicion, two standard planes are not sufficient to rule out the suspicion.
6.14d: Under fluoroscopy, the beam must be tilted around the talus dome, and the smallest distance from the screw tip to the talus dome (cortex) must be determined.
Fig. 6.15: A “beautiful” image of the bone structure of the sternum (Breastbone)
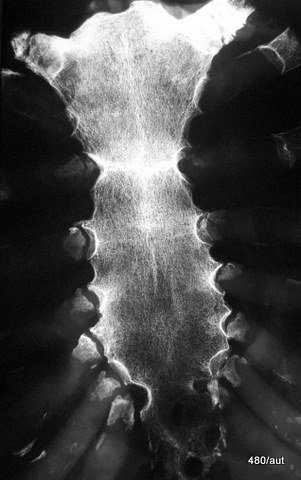
6.15. The image is of good quality. The cause is artificial:
It is a specimen! This artificially avoids any overlaps and ensures optimal conditions. The depiction of the non-calcified cartilage is unusually good. Within the soft tissues, this non-calcified cartilage would not be distinguishable. (See also 09 and 10 Radiation Protection: Pediatric Pelvis)
The central ossifications of the rib cartilage near the joint connection with the corpus are well displayed.
There is another form of ossification of the rib cartilage; the cartilage near the breastbone is surrounded in a cuff-like manner.
Special quality can have artificial causes.
6.16: Two patients, two findings that can be classified as artifacts. Is there a concretion in the ureter?
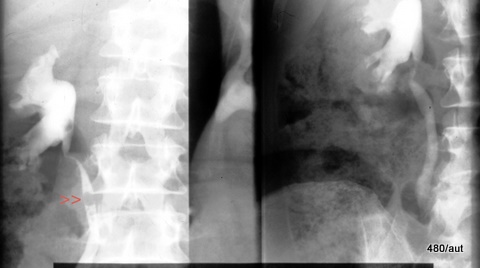
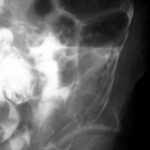
6.16 Left: Iatrogenic air bubble introduced into the lumen during retrograde visualization of the ureter.
The distinction between artificial air bubbles, concretions, or masses is not easy. A first impression is not sufficient. Documentation should be made.
The differentiation is aided by the variability of the air bubbles with positional changes, respiratory movement, compression, and physiological ureteral movement.
The physical and physiological characteristics of air compared to hard and soft tissues help in distinguishing them.
Right a different case: Air bubbles in the intestines overlap the ureter and can mimic a pathological finding. Distinguishing between fact and artifact is a classic problem here.
A small variation in projection can bring clarity.
Fig. 6.17: Emergency, Sepsis. Fact or Artifact?
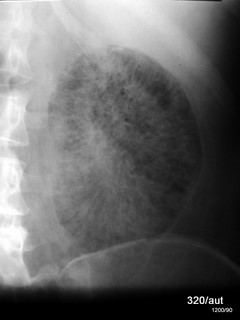
Fig. 6.17:
Nephritis caused by gas-forming bacillus. Sepsis.
The renal parenchyma is streaky and mottled with gas distention.
The image is so unusual and grotesque that one might momentarily suspect and hope to be facing an artificial product. The clinical context dominates the diagnosis.
The unusual finding fits very well with the dramatic clinical picture.
The rapidly progressing sepsis was uncontrollable despite immediate nephrectomy and ended fatally.
With many thanks for the kind contribution by Dr. Osman Mahmalat / Hagen.
Fig. 6.18: Procedure for Bleeding from Esophageal and Gastric Varices. Underlying long-standing Liver Cirrhosis.
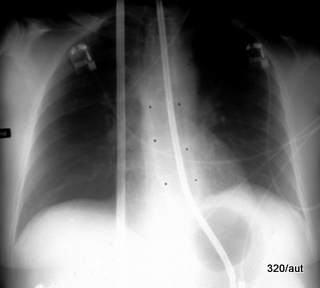
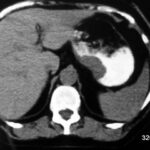
6.18. The acute bleeding was treated with an elongated balloon in the distal esophagus and a round balloon in the gastric fundus.
Both balloons are air-filled and displace the soft tissue. Therefore, they “take away more” than they add. That is why
they appear dark.
– The majority of the participants in my course initially had difficulty with this sentence. –
How would the balloon appear if it were inflated outside the body, placed on the abdomen, and X-rayed? Nowhere would the balloon appear dark! It would hardly show up at all; only the tangentially struck wall of the balloon would create a curved, very fine white line.
This X-ray image is not an artifact but must be understood through the rules of physics.
The second (seemingly) somewhat thicker tube – left of the center – is outside the body.
(The above rules were also demonstrated in 09 on an artifact: a light bulb in the intestines. The interpretation of this artifact is greatly facilitated by the knowledge of the above image.)
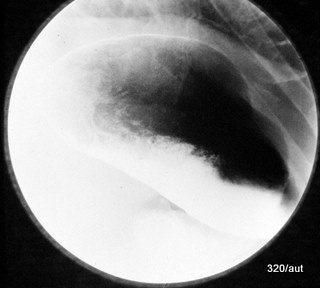
Fig. 6.19: Stomach Dome (Fundus) Marked in the Lying Position by a Swallow of Contrast Agent. This Simple Image is Educational for All Professions Responsible for Critically Ill Patients.
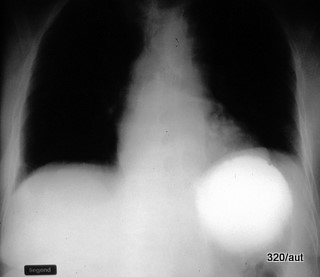
6.19. The situation described here marks the beginning of the final phase of life for a number of such patients. It is benign, and the danger can be resolved with a few simple steps and proper guidance.
The poor quality of the image, for several reasons, should not confuse us, as an important issue is being clarified.
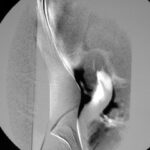
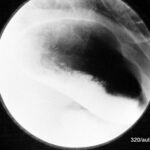
The stomach fundus is positioned very far back (dorsally); in it, much fluid accumulates and stagnates in the lying position. This large white spot corresponds to the swallowed contrast agent. (In the peculiar X-ray terminology, the term “shadow” is used, even when something very bright in the image is meant.)
A large amount of acidic fluid accumulates in the stomach dome and cannot move further. This leads to the painful belching of stomach acid and vomiting, with complications that can lead to aspiration and life-threatening pneumonia.
Everyone is concerned: If you find people lying on their backs who are suffering from belching or even vomiting, they must be gently but immediately turned to their side (to the right side), and the upper body should be slightly raised.
The stomach fundus can then empty over the corpus (the middle part of the stomach) and the antrum. The patients often feel wonderfully relieved. This image should be taken to heart by all caregivers and doctors!
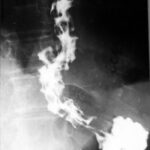
By the way, this image also shows the corpus of the stomach. The air-filled part of the stomach is shown as “dark.” As mentioned, the “liquid” cannot move because this corpus/antrum of the stomach is positioned very far forward.
Is the strong bright spot an artifact?
No, it is a physiological finding. A finding that is very helpful for our understanding of the stomach and teaches us how to help the patient significantly with simple measures.
Fig. 6.20: Different visualization of gallstones inside and outside contrast-filled bile.
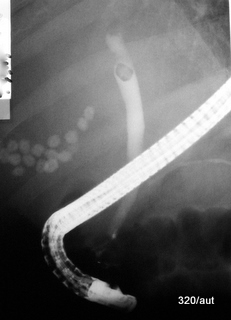
6.20: Endoscopically (from the digestive tract), the bile duct is filled with contrast agent. The procedure is called ERCP.
In the gallbladder and bile duct, there are stones with the same composition (made of cholesterol, calcium, and pigment), as was later confirmed. Initially, it was hard to believe. The calcium is centrally located.
Although the stones are composed of the same materials, the stone in the bile duct appears much darker compared to the stones in the gallbladder. This surprising effect seems to be caused by the surrounding contrast bile.
In the stones in the gallbladder, only the calcium core is visible. The shell of these gallstones does not stand out from the bile fluid and therefore is not shown.
In addition to the composition, the size is also misjudged:
The concretion in the bile duct is correctly assessed in terms of size.
The concretions in the gallbladder are, in contrast to those in the bile duct, grossly underestimated in size.
What stands out is that they maintain a distance between each other. This could indirectly suggest that they are larger than initially assumed.
Why does this error occur? Is it an artifact? It is more of a misjudgment of physical laws.
Fig. 6.21: Different visualization of gallstones depending on body position.
Contrast-filled gallbladder in standing position (left) and lying position (right).
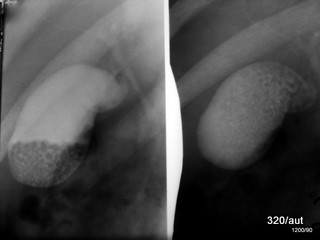
Fig. 6.22: What differentiates these images from the previous one?
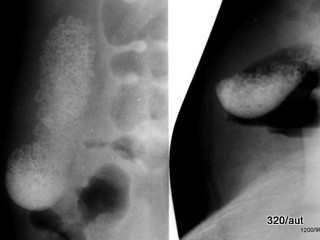
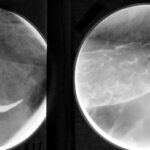
6.21 Upper Image Pair: Examination after intravenous contrast for the gallbladder. Delicate bile duct. Gallbladder – left in the standing position – right in the supine position.
In the standing position (left image), most of the gallstones have fallen down. Only a few seem to be stuck at the dorsocaudal wall, near the infundibulum.
In general, bodies arrange themselves in liquid according to their density: according to their relative density compared to the surrounding liquid. Heavier bodies than the liquid sink to the bottom; those with lower density than the liquid float up, and bodies with the same density as the liquid float in it. This is also known from the Ellermannchen test, which is used to determine the densities of bodies (see Schmitt, Hoffmann, and Andermann, Virchow’s Archive 1975).
In our case, the standing image proves that at least the majority of the stones are denser than the (contrasted) bile fluid.
Now, there is a strange phenomenon: this contrast bile attenuates the radiation apparently more than the denser mixture of the fallen stones. In addition, there is a small amount of contrast-enhanced bile fluid between the stones, which is irrelevant for the effect.
The contrast bile is shown as brighter in the X-ray than the accumulation of the fallen stones. A horizontal “mirror” forms between the concretions “below” and the bile fluid “above.”
To resolve this paradox, one must note that attenuation of radiation depends not only on density but also on the effective atomic number. The latter is effectively increased by the iodine content. This causes the impressive attenuation of radiation compared to the stone mixture, with the bright representation in the X-ray. The density of this contrast bile is, however, only slightly increased, which allows the stones to sink to the bottom.
In the right image section, in the supine position, the “stone material” is spread throughout the gallbladder. We cannot see it in this view, but here too, the gallstones are below, with the contrast bile on top. This is explained by the standing image but also by the fact that in the supine position, the stones accumulate in the deeper part of the infundibulum.
One must apply the laws of nature to understand the images; this is not an artificial product.
6.22 Lower Image Pair: In this other patient, no contrast for the gallbladder was given. Nevertheless, two phenomena are very similar to the previous case. The stones are arranged depending on whether the patient is lying (left image) or standing (right image). Furthermore, the bile fluid is brighter than the stones, and it clearly has a stronger attenuation of radiation than the stone material. These are multiple concretions, likely not uniform in size, not perfectly round. Since no gallbladder contrast was administered, it must be some kind of “chalky milk,” essentially a liquid “stone material.” This strange, pathological fluid in the gallbladder is not only more radiopaque than the stones, but also denser than most of the stones, which on the right image in the standing position mostly float in the upper part of the chalky fluid. Some appear to float, and a few others sink to the bottom of the fundus.
Even without contrast, the bile fluid here has such density and atomic number that it is once more radiopaque than the stone material. The fact that it is denser than some stones comes from the fact that these float in it or float at different levels within it.
Apparently, the bile fluid is not homogeneous, but these two physical properties increase along a gradient from top to bottom. This allows the stones, whose composition is also not entirely uniform, to settle at different levels.
The left image was taken with the patient lying down: the concretions are spread throughout the entire gallbladder, from the fundus to the infundibulum. It is not entirely clear why the dense fluid in the fundus does not run towards the infundibulum. It is likely that the viscosity of the bile fluid causes this adjustment to happen with some delay according to density. We have not yet provided the final proof of this.
(see WGH Schmitt et al. Density of Gallstones. RöFo 1979)
X-ray no longer plays a role in the diagnosis of gallstones, as it has been replaced by ultrasound. However, this is not the case in combination with endoscopy, particularly in the diagnostic workup of the bile duct
6.21: In the standing position (left image), the majority of the gallstones have fallen down. Their density is still greater than that of the contrast bile. However, the contrast bile apparently attenuates the radiation more strongly than the mixture of the fallen stones, which is not free from contrasted bile fluid. Radiation attenuation depends on density and effective atomic number. The latter is apparently effectively high due to the iodine content (despite the moderate density).
A horizontal “mirror” forms between the concretions “below” and the bile fluid “above.”
Only a few concretions have apparently not yet completely slipped down and are lying on the wall of the gallbladder (medially and near the infundibulum). The bile duct is delicate.
In the lying position (right image), the “stone material” is distributed throughout the entire gallbladder. Mainly the outlet area, the infundibulum, is filled.
One must apply the laws of nature to understand the image; it is not an artificial product.
6.22. In this other patient, there are multiple concretions in the gallbladder that are not uniform in size and not perfectly round. Additionally, there is a peculiar phenomenon: the bile fluid around the stones is highly radiopaque; since no gallbladder contrast agent was administered, it must be some form of “chalky milk.”
The same phenomenon as in the previous case. Positional changes of gallstones in the standing and lying positions. But the bile fluid is not stained with contrast medium. It is not only radiopaque, but also denser than the stones, which, in the right image in the standing position, mostly float in the upper part of the chalky fluid.
Even without contrast, the bile fluid here has such a density and atomic number that it is more radiopaque than the stone material. The fact that it is denser than some stones results from the fact that these float on it or float at different levels within it.
Apparently, the bile fluid is not homogeneous, but the two mentioned physical properties increase along a gradient from top to bottom. This allows the stones, whose composition is also not entirely uniform, to settle at different levels.
The left image was taken with the patient lying down: the concretions are spread throughout the entire gallbladder, from the fundus to the infundibulum. It is not completely clear why the dense fluid in the fundus does not run toward the infundibulum. This process will probably occur with some delay.
(see WGH Schmitt et al. Density of Gallstones. RöFo 1989)
X-ray no longer plays a role in the diagnosis of gallstones, as it has been replaced by ultrasound. This is not the case in the diagnostic workup of the bile ducts, such as through ERCP.
Fig. 6.23a: Apparent Tumor in the Stomach
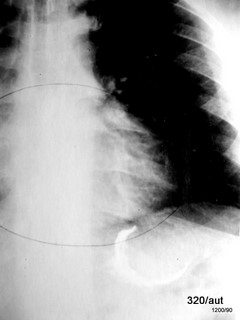
6.23a. This cardiology patient received a lateral chest X-ray before this p.a. chest X-ray, with the esophagus marked by a swallow of contrast agent.
At first glance, one might think: Is this a large carcinoma? A tumor surrounded by contrast medium.
However, it is an artifact. A source of error:
An incomplete, thus technically faulty, filling. This image is unsuitable for stomach imaging.
We are not hesitant to classify this finding as an artifact. See the next images 23b.
Fig. 6.23b: The Same Pseudo-Tumor in the Stomach in Two Planes
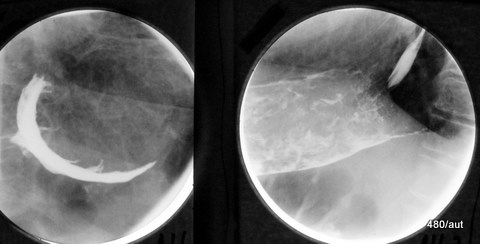
6.23b. The filling defect in the stomach fundus (noticed on a chest X-ray) is actually a lack of contrast in the typically located far-dorsal stomach fundus and a circular contrast in the corpus.
Left image: From the front, a crescent-shaped structure appears. A classic artifact.
Right image: This is how the finding appears in the lateral projection. – The distal esophagus is also marked.
Fig. 6.23c: How to Make the Artifact 23a and b Disappear
6.23c. When repositioned, the stomach fundus is contrasted, and the false impression of a mass has disappeared.
The error does not lie in an object that is in the wrong place. The contrast agent swallow is not primarily wrong; what is wrong and incomplete is our understanding of how the contrast agent can spread and be displayed.
The artifact can also be in the mind of the observer. Why not?
The correction there is easiest through… learning.
Fig. 6.24: A Strange “Protrusion,” a “Wart” on the “Aortic Knob”
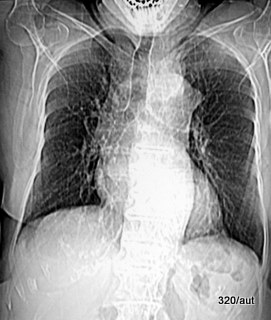
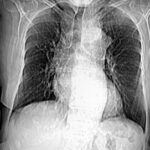
6.24: The topogram (also scanogram) is part of a CT examination. It is an X-ray image produced by the CT; it has a coarse image matrix and requires (impressively) very little dose. It is used for planning a section examination. Hence, the seemingly incomplete caudal exposure.
Representation of an aortic nipple. It is a harmless variant: corresponding to a prominent superior intercostal vein running over the aortic knob. Classification is also appropriate in Chapter 7.
(Literature can be found with Alexander Rosenberger/ Haifa. The first description in MR was by Mircea Medrea DEPARTAMENTUL de IMAGISTICÃ ,CT, RMN, Bucuresti).
Fig. 6.24b: Classic differential diagnosis of a widened mediastinum:
Thymoma,
Teratoma,
Thyroid gland (retrosternal goiter),
Thomas Hodgkin (where Sternberg could also be mentioned)
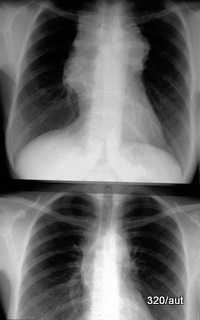
6.24b. Significant widening of the silhouette of the mediastinum. Hodgkin’s disease (where Sternberg could also be mentioned)
Above: before – below: after mantle field radiation and chemotherapy for Hodgkin’s disease.
Fig. 6.25: “Missing Diaphragms”?
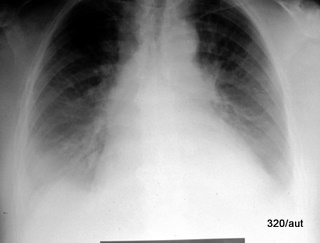
6.25: Of course, the diaphragms are not missing. (They can be clearly displayed sonographically). What is missing are the diaphragmatic silhouettes, i.e., the radiological visibility in the standard chest X-ray (= standing PA). The middle and lower fields are essentially covered by a homogeneous “filter”, which is actually pleural effusions. They dominate the chest X-ray. They are very clearly visible in sonography. To prove and quantify the effusions, the chest X-ray would not be necessary. Sonography provides excellent assistance in this regard. (See B. Kurtz and WGH Schmitt, Ultrasound and Pleura)
The right and left heart silhouettes are not erased; they are often absent in various types of pneumonia, and in many different ways. (See the classics by Felson, Frazer, and Paré, also see the next two cases)
Here, the change is outside the lung, namely an effusion around and behind the lung. No disease within the lung. Or is there? As so often, there is a small flaw:
A delicate aer bronchogram, the very clear depiction of small airways. One could additionally suspect consolidation within the lungs.
Undoubtedly, this case presents a pathological finding and not an artifact. It would actually belong in Chapter 7. However, due to the physical rules regarding the “silhouettes,” it fits very well here.
Fig. 6.26: Pneumonia, Specifically Middle Lobe Pneumonia
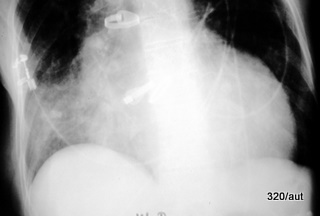
Fig. 6.27: Lower Lobe Pneumonia on the Left
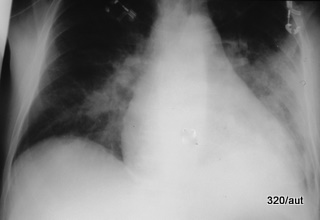
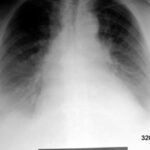
6.27. Left Lower Lobe Pneumonia. In the shadowing of the left middle and lower fields, the diaphragm contour is distinctly blurred, but the heart contour is preserved. The lung infiltration lies far dorsally and corresponds to the left lower lobe.
These lung shadowings have their particularities that must be recognized and understood. Understanding the anatomy and physics leads to a better diagnosis. This should hopefully fit well into the diagnostic concept and assist in the therapy.
The three most recent cases are undoubtedly far from being artifacts.
Fig. 6.28: Shell sign using the example of pleural calcification.
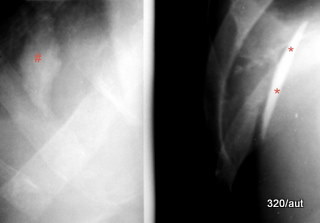
6.28. Left: Marked by the red diamond, the orthogradely (in top view) X-rayed pleural calcification is weakly contrasted and is often “overexposed,” making it completely unrecognizable.
Right: Pleural calcification, which is “hit” tangentially.
Due to such a projection, the material is summed over a (approximately 7x) longer distance (stars), creating an intense, sharp white line. This has been demonstrated in the four Pleura/Thorax contributions 04-07 with very similar cases.
Never say, “The calcification is from the inner thoracic wall, so it must be the visceral pleura”—that is utter nonsense! See the referenced contributions.
Fig. 6.28b: Two glass splinters in the soft tissue, left thumb. Why is the foreign body represented so differently in both planes?
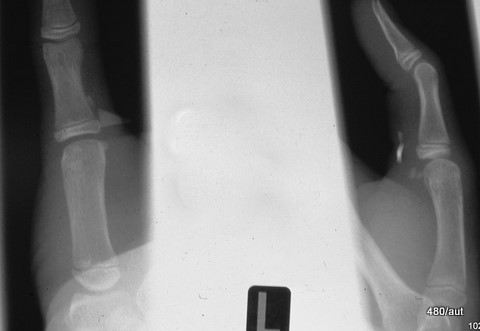
6.28b: The glass splinters are located at the level of the MCP joint I, volar/ulnar. This is the joint between the metacarpal and the thumb; volar means towards the palm, and ulnar refers to the side of the ulna.
The larger splinter is depicted significantly better in one of the two projections.
In this “diagnostically favorable” X-ray projection, it is hit tangentially, which leads to stronger radiation attenuation (compared to orthogonal X-ray projection).
Please also ensure that the smaller, difficult-to-detect glass splinter is not overlooked.
These are not “artifacts in the strict sense.” They are actual findings of clinical significance. At most, the fact that these foreign bodies may not be visible on a poor-quality image could be considered “artificial” to me. In such cases, a poor-quality image would be characterized by an inadequate understanding of physics, thereby reducing the chances of a correct diagnosis.
Fig. 6.30: Shell sign with its typical profiles (= radiation attenuation along a path)
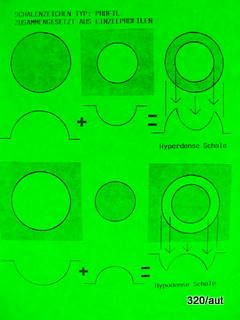
6.30: The profile of a shell is not easy to understand. a + b = c in two different cases: a hyperdense shell and a hypodense shell.
If not understood correctly, it can be mistaken for artifacts.
In both cases, we observe summation effects from round hyperdense or hypodense structures. On the far right, the summation of the bodies located to the left is visible. The profiles are also summed!
In other words: A shell can be imagined as being composed of a round hyperdense structure and a similarly round hypodense structure. Both exhibit a characteristic profile in X-ray imaging: a typical radiation attenuation along a path—here, along the diameters.
There are two individual profiles for the outer and inner contour of the shell.
When summed together, they form the profile of a shell!
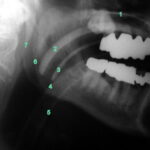
Fig. 6.29: Different tubes in the neck: Guedel tube, tracheal tube
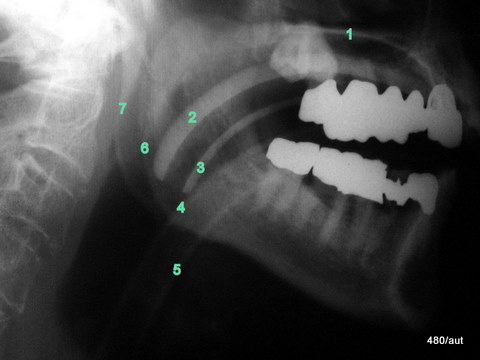
6.29: The X-ray image is much easier to understand if one is familiar with physics.
From “tubes with typically denser walls,” two bright “rails” appear in the X-ray image (as sketched in 6.26).
This means the wall is most clearly visible where it is tangentially penetrated by the X-ray beam.
Guedel tube (2 and 3) and tracheal tube (4 and 5) are depicted in their typical manner.
A bit more anatomy:
1 is … the hard palate,
6 and 7 are … the dorsal boundaries of the two ascending branches of the mandible.
Artifacts III, Chapter 7: Pathology Misinterpreted as an Artifact
In general, a clear distinction can be made between a man-made artifact and a “genuine pathological” finding. Only occasionally can this be difficult—medicine is complex, after all.
This distinction is crucial for determining the appropriate action:
For a pathological finding, the key question is: Is therapy possible and necessary?
For an artifact, any attempt at “therapy” would be complete nonsense, and the focus should be on strategies for future avoidance.
The findings shown here correspond predominantly to real diseases and, like some images in Chapter 6, are mostly not artifacts.
However, some of these pathological images are so unusual and bizarre that even experienced practitioners might initially consider them artificial. Hopefully, only “at first glance.”
The differentiation between normal and pathological conditions is made easier by the fact that while the number of anatomical variants is large, it is still manageable enough to be compiled in a few good books (Köhler/Zimmer; Keats).
A healthy bone (e.g., the clavicle) varies only slightly from individual to individual.
Anatomical variants can be documented fairly comprehensively in a single book, but capturing the full diversity of pathological conditions would require many volumes.
The textbook by Köhler was later edited by Freyschmidt, while Keats is a key reference in the English-speaking world.
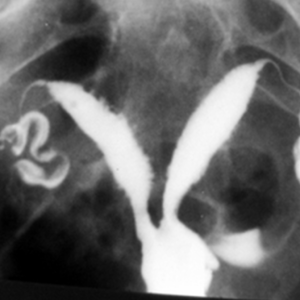
Fig. 7.01: Retrograde filling of the renal pelvis and calyceal system (via urethra, bladder, ureter) with contrast agent.
Fornix rupture
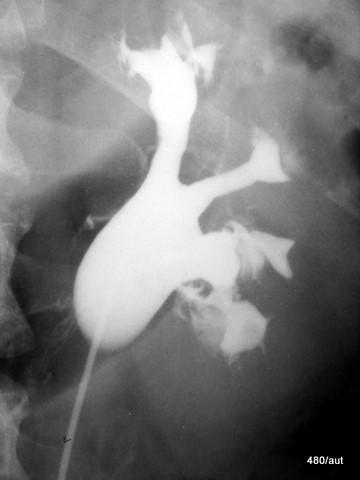
I7.01: Are the strange streaks and duct-like structures at the edges of the (dilated) renal pelvis and calyceal system (RPCS) an artificial artifact?
The finding appears somewhat unusual, leading one to doubt its authenticity. This skepticism might be reinforced if the abnormality is no longer detectable in a follow-up X-ray examination.
However, this is a genuine finding:
A fornix rupture (tear at the weak point of the renal pelvis).
Such changes occur due to pathological pressure increases in the urinary tract. The cause is often iatrogenic.
There is a progression:
With abnormally increased pressure in the urinary tract, the following stages occur:
– Initially, only a “discoloration” of the papillae (pyelotubular reflux) is observed.
– With a stronger manifestation:
– Contrast medium drainage via the lymphatic vessels (pyelolymphatic reflux) or
– Pyelovenous reflux
– Only in severe cases do extravasations into the tissue of the renal sinus develop.
(Examples can also be found in Contributions 09 and 10.)
Such images occur when a ureter is obstructed by a stone, a tumor, or—as in this case—through retrograde filling.
(http://www.students.informatik.uni-luebeck.de/zhb/ediss712.pdf)
Schmitt, W.G.H., M. Hofmann et al: Causes of Contrast Medium Extravasation. Uro Imaging 1 (1991) 46-52
Schneider, G. et al: Localized Retroperitoneal Extravasation after Reflux in Infusion Urography. Röntgenblätter 30, 474.
Fig. 7.02: Shell-like calcified barrel stone of the gallbladder or renal pelvis cast stone?
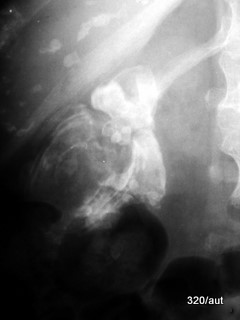
7.02: The bizarre, calcified structure might initially be mistaken for an artifact.
Fortunately, the patient’s medical history is usually informative, except in rare cases.
Additionally, further imaging projections and ultrasound are available. Both approaches are correct—not “either/or” but “both.”
Superimposition:
Two calcifications are summed in this X-ray image:
– A shell-like calcified gallstone and
– A stag-horn-shaped renal pelvis cast stone.
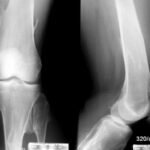
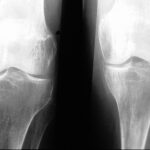
Fig. 7.03a and b: Stress fracture? More precisely, insufficiency fracture in both the distal femur and the proximal tibia (tibial plateau).
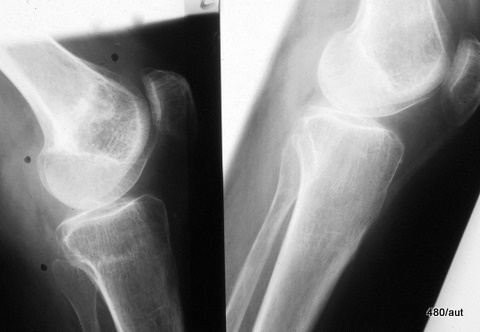
7.03 b:
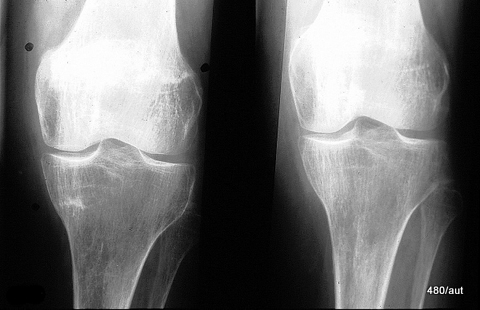
7.03. The 73-year-old patient has suffered from chronic polyarthritis for years.
Recently, her medication was optimally adjusted, leading to a remarkable improvement—she blossomed and was able to take long walks again.
This activity was interrupted by pain in her left knee joint.
The pain was different in nature from the chronic polyarthritis (CP) pain she had experienced for years.
Images a and b show the left knee joint from two different planes.
The two left images were taken two weeks after the onset of pain, while the two right images were taken after several weeks without overuse.
(“Distal” means away from the body, “proximal” means closer to the body.)
Is the blurred, streaky density in the distal femur and proximal tibia (marked by black dots) a genuine finding or an artifact?
Could it be a technical error, an unusual overlay, or something that could be dismissed as “insignificant”?
No! Given the clinical context and the X-ray findings:
Definitive insufficiency fractures!
(A specific form of stress injury in a diseased bone.)
If the overuse had affected a healthy bone, it would be classified as a stress fracture.
Since the bone is already compromised due to CP, it is, by definition, an insufficiency fracture.
The strongest proof for this hypothesis:
A rapid clinical improvement with rest and the complete disappearance of these insufficiency fractures on follow-up imaging after three months.
This is clearly documented in the right-side images.
Both elements confirm that this is a real pathological condition:
Insufficiency fractures are often overlooked but, fortunately, they are benign.
By the way, the a.p. (anterior-posterior) view (b) is an example of a poor-quality X-ray:
It is so underexposed that the pathology in the femur is difficult to recognize.
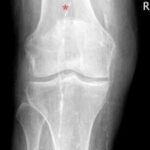
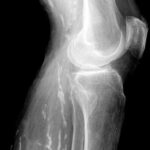
Fig. 7.04a + b: Right knee joint in two planes. Calcification in veins or arteries (blood veins or arteries)?
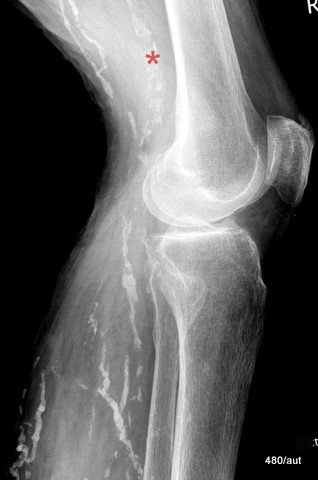
7.04a + b: Most likely, these findings indicate:
– Multiple thrombi in veins that have shrunk, become organized, and calcified.
– Patchy calcifications in a dilated popliteal artery (arteriosclerosis of the Mönckeberg type, marked with a red * in both images).
Technical note: The cassette is positioned medially as an exception.
We view the X-ray image as the X-ray beam falls onto the object—this is the standard convention.
04b: Additional plane from the front (a.p. view).
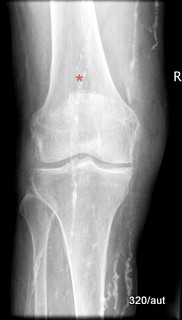
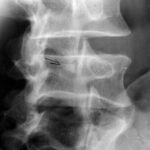
Fig. 7.05: Persistent apophysis of the inferior articular process of the 3rd lumbar vertebra in an adult
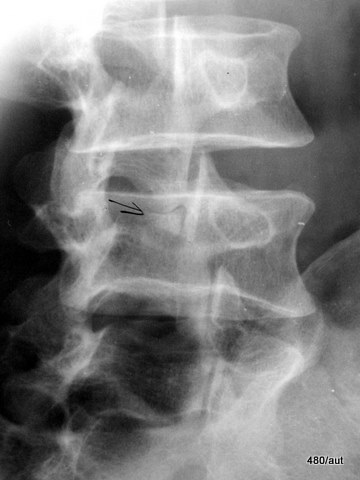
7.05: 45° oblique X-ray of the lower lumbar spine.
Sectional view. The initial aim was to check for spondylolysis, which refers to an interruption in the vertebral arch at the lamina (i.e., between the superior and inferior articular processes).
The oblique X-ray beautifully illustrates the so-called “Scotty dog” sign:
– Snout = transverse process,
– Eye = pedicle,
– Ear = superior articular process,
– Collar = pars interarticularis,
– Forelegs = inferior articular process.
The latter, marked with a black arrow, shows the persistent apophysis.
Apophyses are bony projections, where a growth plate exists during youth and typically fuses in adulthood.
In this adult patient, the growth plate of the articular process has remained open, appearing as a faint dark line.
Dark lines on an X-ray can indicate fractures (though they may also appear as bright lines); they can also be artificial, such as from a crease in the film.
In this case, we are confident that it is a real, yet harmless, finding. However, convincing the patient of its harmlessness can be challenging.
Whether this bone maturation anomaly was influenced by overuse during adolescence remains unclear.
If such a connection were proven, it would be an interesting scientific observation, though of no clinical relevance to the patient, as no resulting impairment can be logically justified.
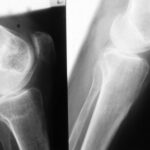
Fig. 7.06: Cartilaginous exostoses of the distal femur and proximal tibia
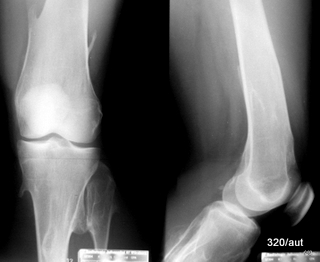
7.06: Once you have seen this classic finding, you will recognize it again:
Cartilaginous exostoses,
or osteochondromas in modern terminology.
This is clearly not an artifact but a pathological finding.
These protrusions of the bone contour are covered with cartilage and are therefore usually more prominent upon palpation than on X-ray images, which only visualize the bone but not the cartilage.
In most cases, these changes are simply monitored and only surgically removed if they cause significant discomfort to the patient or compress important structures such as nerves or blood vessels.
Unnecessary surgical interventions should be avoided.
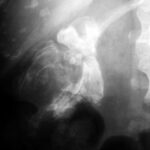
Fig. 7.07a: Comminuted pelvic fracture, status post plating of the left hip bone and surgical hip joint replacement.
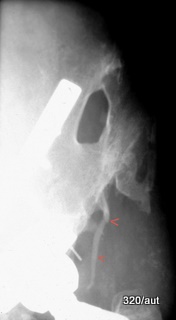
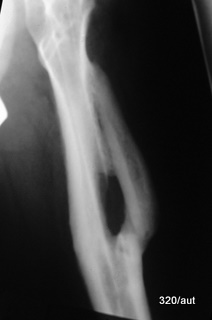
Fig. 7.07b: Different patient with cavity formation after femoral fracture
7.07a:
Grotesque deformation of the iliac bone with a large, round, sharply defined bony defect.
The coarse, but also very fine trabeculae (red arrowheads) raise doubts about whether such a deformation could be real.
Could an artifact be overlaying normal physiological structures?
Could this be a congenital malformation, entirely unrelated to the trauma history?
The image is deliberately presented in a brightened form.
As shown here, it would be entirely unsuitable for assessing the hip joint.
In fact, unusual healing patterns of fractured bone are possible.
This can result in spiky projections, trabecular bands, and even cavities (see case b).
Contribution 03 specifically discusses healing patterns after transverse process fractures.
Fig. 7.08: Chisel fracture of the radial head
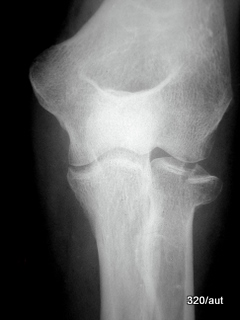
7.08:
Fall on the hand with an outstretched arm. Pain on the outer elbow.
Rotating the hand and forearm is painfully restricted.
The X-ray was correctly performed:
The forearm bones are parallel to the film, and the central beam is perpendicular to the film.
However, collimation to the radial head could be improved.
To free the radial head from superimposition by the adjacent ulna, either the elbow must be pulled medially, or the central beam must be angled from medial/superior to lateral/inferior. (This is best understood by examining your own elbow!)
In this projection, more than two target images of the radial head are taken in different positions (i.e., different degrees of pronation and supination).
This method was described by H.G. Schmitt to detect radial head fractures, which are often missed in only two standard planes.
Severe chisel fractures are rarely missed, as they dominate the clinical presentation and cause painful restriction of pro- and supination.
This type of injury is one example where conventional X-ray imaging in more than two planes is useful.
For those unwilling to take the extra views, a cross-sectional imaging method (CT) should be used instead.
These fractures are also called “chisel fractures” because they result from shear or compressive forces that “shear off” prominent bony segments.
They typically create osteoarticular fragments.
(Note: The Barton fracture is not the same as a radial head fracture!
It is one of the four types of distal radius fractures—specifically, the intra-articular type.)
Fig. 7.10: What are the dark streaks?
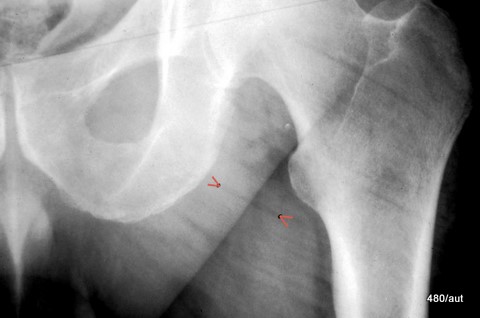
7.10: Atrophy of the gluteal musculature
Nine months after a left-sided hemiplegia, the patient suffered a fall.
X-ray imaging was performed due to suspicion of a femoral neck fracture.
The image is underexposed, with excessive external rotation of the hip joint. Additionally, it is overlaid by dark streaks (see arrowheads).
Are these streaks artifacts, or could they be a pathological finding related to the patient’s medical history?
The gluteal musculature is atrophied:
Between the relatively coarse muscle fibers, fat has accumulated.
Due to its lower density compared to muscle tissue, it appears as inhomogeneous structures on the image.
These streaks are not part of the adductor muscles or the numerous external rotators, as they extend laterally beyond the femur.
In CT imaging, this fatty infiltration of atrophic musculature is even more pronounced.
For example, in the erector spinae, it often occupies the space beneath the muscle fascia and extends between muscle fibers.
Fig. 7.12: Status post sternotomy for coronary artery bypass graft surgery (CABG)
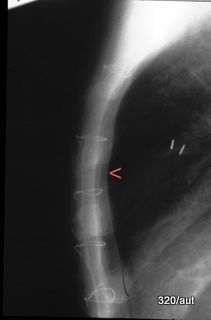
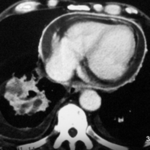
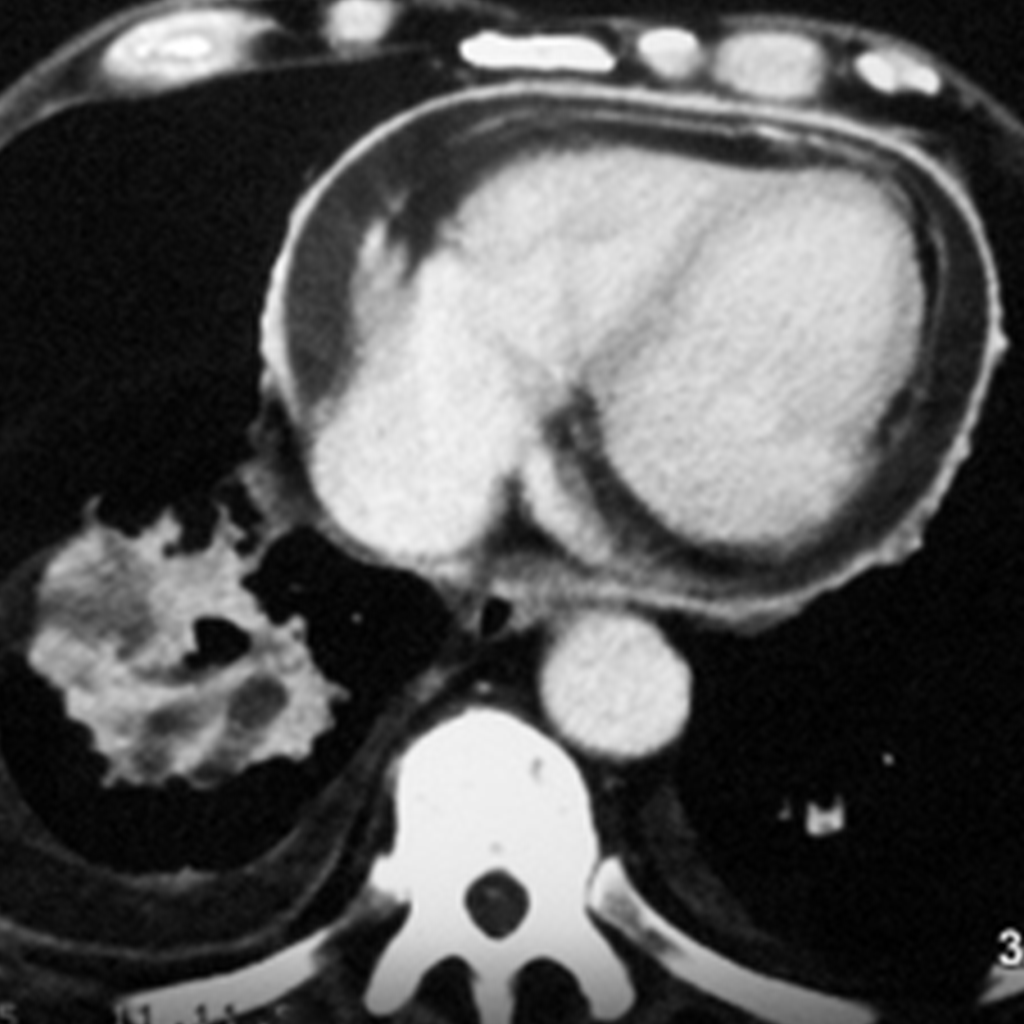
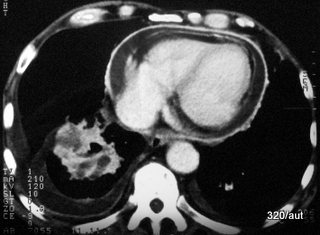
Fig. 7.13: Thickening and pathological contrast enhancement of the parietal pericardium in a large bronchial carcinoma
First Image 7.12:
Retrosternally (see arrowhead), a soft tissue-density accompanying shadow is visible along the posterior surface of the sternum.
Is this an artificial phenomenon or a genuine finding?
This represents a tissue layer with a significant amount of fat.
Such subpleural fat accumulation could be a symptom more frequently observed in coronary artery disease (CAD).
This impression emerged during the review of a large number of myocardial infarction patients at the Roderbirken Clinic in Leichlingen.
These cases were compared with a cohort of non-CAD patients, among whom there was also a relative prevalence of obesity.
Thus, subpleural fat accumulation appears to be more common in the coronary heart disease patient group.
Lower Image 7.13:
CT scan with intravenous contrast medium (CM); depiction of a relatively thick layer.
The contrast study is most evident at the descending aorta.
The bronchial tumor partially absorbs the contrast agent.
Both pleural layers show significant contrast enhancement, with the most intense uptake in the thickened parietal pericardial layer.
Both pericardial layers are separated by a small effusion.
This finding could also be well assessed and quantified using ultrasound.
Artificial phenomenon?
No, this enhancement is quite likely associated with a progressive tumor disease.
There is no contrast enhancement in the interlobar pleural effusion and, of course, none in the pericardial effusion.
Fig. 7.14: Left upper lobe pneumonia
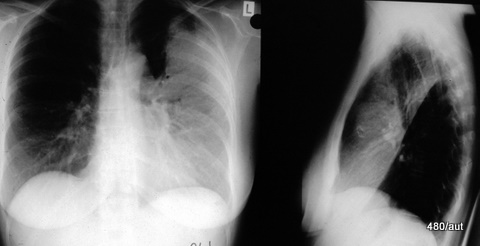
7.14
The lower boundary of the upper lobe is anatomically different on the left compared to the right.
On the left side, the two segments of the so-called lingula are also part of the upper lobe.
This is why “left upper lobe pneumonia” has a completely different shape compared to the right side. (See also the next case).
Fig. 7.15: Bilateral upper lobe pneumonias
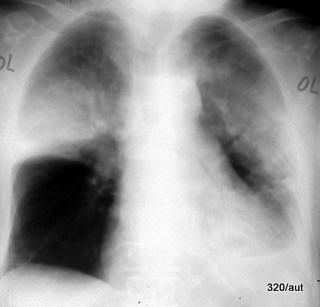
Fig. 7.16: Left tension pneumothorax before and after treatment.
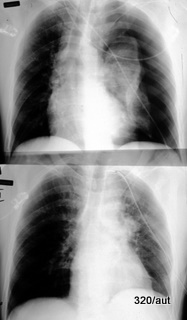
7.15. Upper Image: Why do the infiltrates appear so differently on both sides?
Right: The minor fissure forms a largely horizontal boundary between the diseased upper lobe and the well-aerated middle lobe.
This creates a sharp lower border of the pulmonary opacity.
Left: The middle lobe is absent on this side. The lingula, which has close contact with the heart, belongs to the upper lobe.
The left upper lobe pneumonia also shows a classic air bronchogram.
For didactic purposes, it would have been preferable if the silhouette of the heart was even more obscured and the diaphragm silhouette on the left was more clearly preserved.
The latter is likely obscured by an additional small pleural effusion.
7.16. Lower Image in Two Parts:
This is not a projection error (such as a rotated thorax).
Nor is it an artifact. The lateral portions of the left thoracic cavity are free of lung structures.
The left lung has collapsed into a compression atelectasis.
A classic pathological presentation: The heart and mediastinum (see trachea) are significantly shifted to the right.
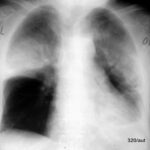
Emergency! Left tension pneumothorax.
Lower part of 7.16: Shortly after the placement of a Bülau drain,
the air between the pleural layers has been removed, and the left lung has re-expanded.
The heart and mediastinum have returned to the midline.
Fig. 7.17: The relief of the distal esophagus is unusually deformed. Pathology or artifact?
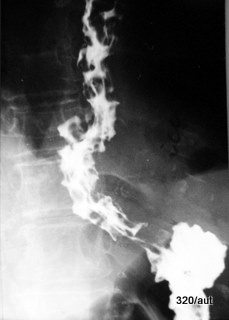
7.17: Esophageal varices on X-ray.
One might ask whether there is an error in the examination technique?
No. This is the classic appearance of esophageal varices,
which present as multiple nodular filling defects within the esophageal lumen.
The most important diagnostic method for this condition is endoscopy.
There are extensive discussions on the causes of esophageal varices.
Briefly, the cause of such varicose veins in the lower third of the esophagus is almost always increased pressure in the portal vein system.
This is most commonly due to liver cirrhosis, as the blood attempts to bypass the obstruction in the liver.
Bleeding can occur, presenting with vomiting of red blood, black tarry stools (melena), and shock.
Shock manifests as a dangerously low blood pressure with a rapid pulse.
This is a medical emergency requiring immediate circulatory stabilization,
bleeding control (now effectively managed endoscopically), and monitoring of liver function.
Fig. 7.18a+b: Post-abdominal surgery fistula opening on the skin. Fistula filling.
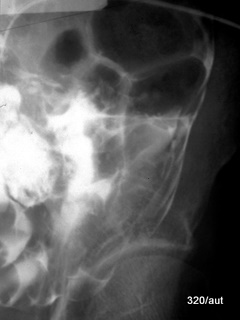
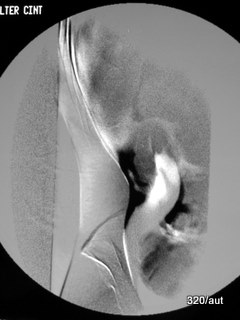
Fig. 7.18b: Subtraction technique of this fistula filling.
7.18a: This contrast-filled fistula exhibits unusual structures.
Connection to the peritoneal cavity.
Anatomical classification may be challenging. On the left side of the image, the ring of an artificial anus (anus praeter) is visible.
Additionally, irregular spaces are present, shaped by impressions from bowel loops.
Thus, there is a direct connection between the body surface and the abdominal cavity.
This is a case of true “pathology.”
In the subtraction technique shown in image b, an image before contrast filling is subtracted from an image after filling.
The result is a visualization of only the contrast medium, with all other structures removed.
This technique highlights the dynamics of contrast medium distribution.
Fig. 7.19: Stomach carcinoma in computed tomography.
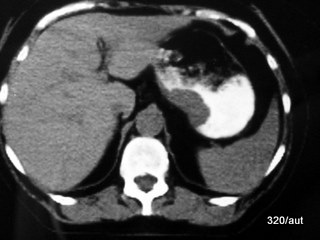
Stomach carcinoma is not an indication for computed tomography.
This is the domain of gastroscopy—endoscopic examination of the stomach.
In this case, it was an incidental finding during imaging for another clinical question.
However, the image provides a good illustration of how a tumor grows within the stomach wall, thickening and stiffening it.
It narrows the inner space of the stomach (the lumen) and may also exert outward pressure.
Another classic imaging technique for visualizing a stomach wall tumor is shown in Fig. 7.20a.
Fig. 7.20a: Conventional gastric imaging. Space-occupying lesion of the stomach wall at the lesser curvature.
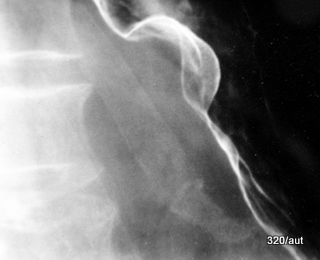
7.20: Examination from several years ago.
Is such a finding in a contrast-filled and air-distended stomach suspicious for an artifact?
No, the shape of the mass, its reproducibility, and the loss of wall motility strongly suggest a malignancy.
This was confirmed by gastroscopy, which is the diagnostic method of choice, especially due to its ability to obtain histological samples.
However, given the notably smooth boundary, other differential diagnoses could also be considered, such as a myoma or a neurinoma.
Fig. 7.20b: Large gastric ulcer – a defect in the stomach wall
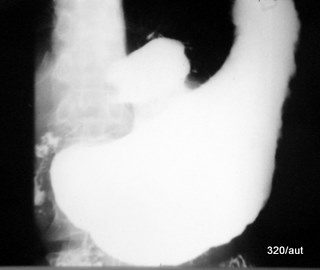
7.20b: Historical image.
We see only the (white) contrast medium in the stomach, which the patient has swallowed.
It also enters the large crater in the stomach wall and fills it—this is an ulcer.
A more visually detailed representation would be achieved with double-contrast imaging.
In this technique, the ulcer wall is coated with contrast medium, while the rest of the stomach is expanded with air.
X-ray imaging is no longer the preferred diagnostic method.
An ulcer is fundamentally different from a tumor.
In an ulcer, something is missing (a tissue defect), whereas in a tumor, there is an excess of abnormal growth.
However, the distinction is not always straightforward, as a tumor can also ulcerate, and a tumor may be hidden within an ulcer.
A gastric ulcer, especially one of this size, is a very serious condition.
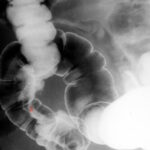
Fig. 7.21: Fact or artifact at the sigmoid-descending colon junction?
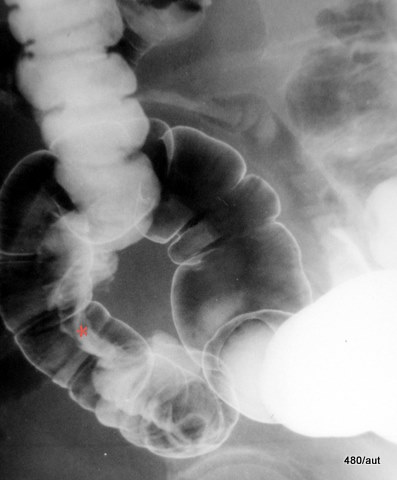
7.21: The finding is marked with a red star.
Colorectal carcinoma
This is not an immediately obvious, straightforward case but rather a finding with diagnostic challenges:
The overlap of an apparently circumferentially narrowed, deformed intestinal segment with a healthy, normally distended sigmoid colon.
Is this an artifact, possibly due to contamination or a temporary contraction of a localized bowel segment?
Further examination confirmed carcinoma, which was verified by colonoscopy and resected without delay.
The patient was discharged on schedule in good health. After two years, the anastomosis function remained intact, with no signs of recurrence or progression.
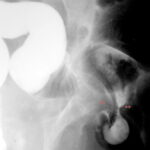
Fig. 7.21b: What is marked by stars?
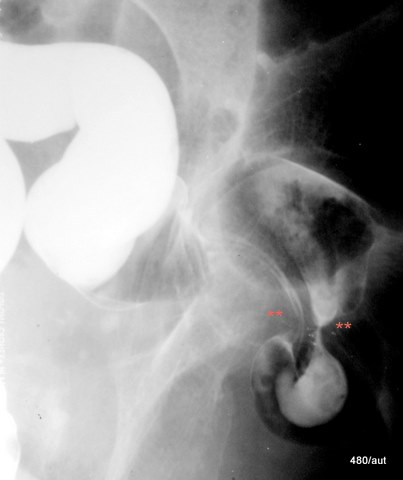
7.21b: Inguinal hernia visualized in a contrast enema study.
The hernia orifice is marked.
This type of colon imaging is not a standard method for detecting an inguinal hernia.
However, when a hernia is incidentally visualized in this way, it provides a valuable learning opportunity.
In this case, the hernia was easily reducible and had not been noticed before the examination.
A strangulated (incarcerated) hernia would require urgent surgical intervention.
In rare cases, a hernia can indicate an underlying bowel disease (e.g., a malignancy).
I’m pleased that Chapter 7 is receiving significant attention.
Please also take note of actual artifacts, such as those discussed in
Black Artifacts, Contribution 11, Chapter 2.
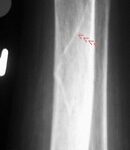
Fig. 6.13: X-ray image with white “lines” in the bone??
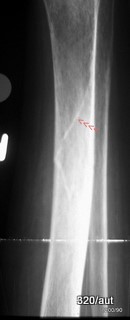
6.13: It is incorrect to think of a fracture only as a black line.
Bone fractures can also appear as white “lines” on an X-ray.
The term “fracture line” can be misleading.
In reality, only “fracture surfaces” exist.
On an X-ray, parts of these fracture surfaces may appear as lines.
A single fracture surface can create two fracture lines, or it may not appear at all in certain projections.
Fragments may be displaced, and osteoporotic bone can become “compressed.”
As a result, fragments can overlap and create white lines in the image.
Classic examples of this phenomenon are found in the skull.
This variety of fracture appearances is an application of the summation effect and the silhouette sign.
6.27

